The ice winter 2024/2025 at the German coasts and the Baltic Sea
Wiebke Aldenhoff
Bundesamt für Seeschifffahrt und Hydrographiewiebke.aldenhoff@bsh.de
Table of Content
- 1 Overview of the ice winter 2024/25
- 2 The ice winter at the German North Sea and Baltic Sea coasts
- 2.1 Weather conditions at the German coastal areas
- 2.2 Ice conditions at the German North Sea and Baltic Sea coasts
- 2.3 Navigational conditions at the German North Sea and Baltic Sea coasts
- 2.4 Ice winter severity
- 3 Ice conditions in the western and southern Baltic Sea, Kattegat and Skagerrak
- 4 Ice conditions in the northern Baltic Sea
- 5 The ice winter 2024/25 in long-term comparison
- 6 Reporting of the BSH
- Bibliography
- Appendix
1 Overview of the ice winter 2024/25
The winter along the German coasts was a weak ice winter and the fourteenths consecutive too warm winter in Germany. Ice formed only during a on week-long cold spell in the mid-February in sheltered places along the Baltic Sea coast as well as in Bodden waters and the Szczecin Lagooon. In the North Sea ice occurred sporadic at places in the Northfrisian Wadden Sea.
The ice winter in the entire Baltic Sea was likewise a weak ice winter in terms of the maximum ice extent. At Sea, a closed ice cover only formed in the Bay of Bothnia. In the Bothnian Sea and the Gulf of Finland, ice off the coast occurred only for a very short period of time. Repeated strong winds from southwesterly and westerly directions caused partly difficult navigation conditions along the Finnish coast of the Bay of Bothnia.
2 The ice winter at the German North Sea and Baltic Sea coast
2.1 Weather conditions at the German coastal areas
The winter 2024/25 was the fourteenths mild winter in Germany in a row according to the German Weather Service [1]. This is reflected by the monthly mean temperatures and their deviation from the reference period 1981–2010 for the stations Norderney, Schleswig, Warnemünde and Greifswald from November 2024 to March 2025 as shown Table 1. The monthly mean temperatures were above the reference period for all months, with December being the comparatively warmest month with temperatures of 2.6 °C to 3.5°C above the long-term average. The smallest deviations occurred in February with temperatures up to 0.6 °C above the long-term reference value. The monthly mean temperatures in November were up to 1.3 °C, in January up to 1.7 °C and in February up to 2°C above the reference period.
| November | December | January | February | March | ||||||
|---|---|---|---|---|---|---|---|---|---|---|
| T [°C] | ΔT | T [°C] | ΔT | T [°C] | ΔT | T [°C] | ΔT | T [°C] | ΔT | |
| Norderney | 7.6 | 1.0 | 6.1 | 2.6 | 3.8 | 1.2 | 2.9 | 0.3 | 6.6 | 1.7 |
| Schleswig | 6.0 | 1.0 | 5.0 | 3.0 | 2.6 | 1.3 | 2.0 | 0.6 | 5.7 | 1.9 |
| Warnemünde | 6.8 | 1.2 | 5.4 | 2.9 | 3.2 | 1.6 | 2.4 | 0.6 | 6.2 | 2.0 |
| Greifswald | 6.0 | 1.3 | 4.9 | 3.5 | 2.3 | 1.7 | 1.5 | 0.5 | 5.5 | 1.8 |
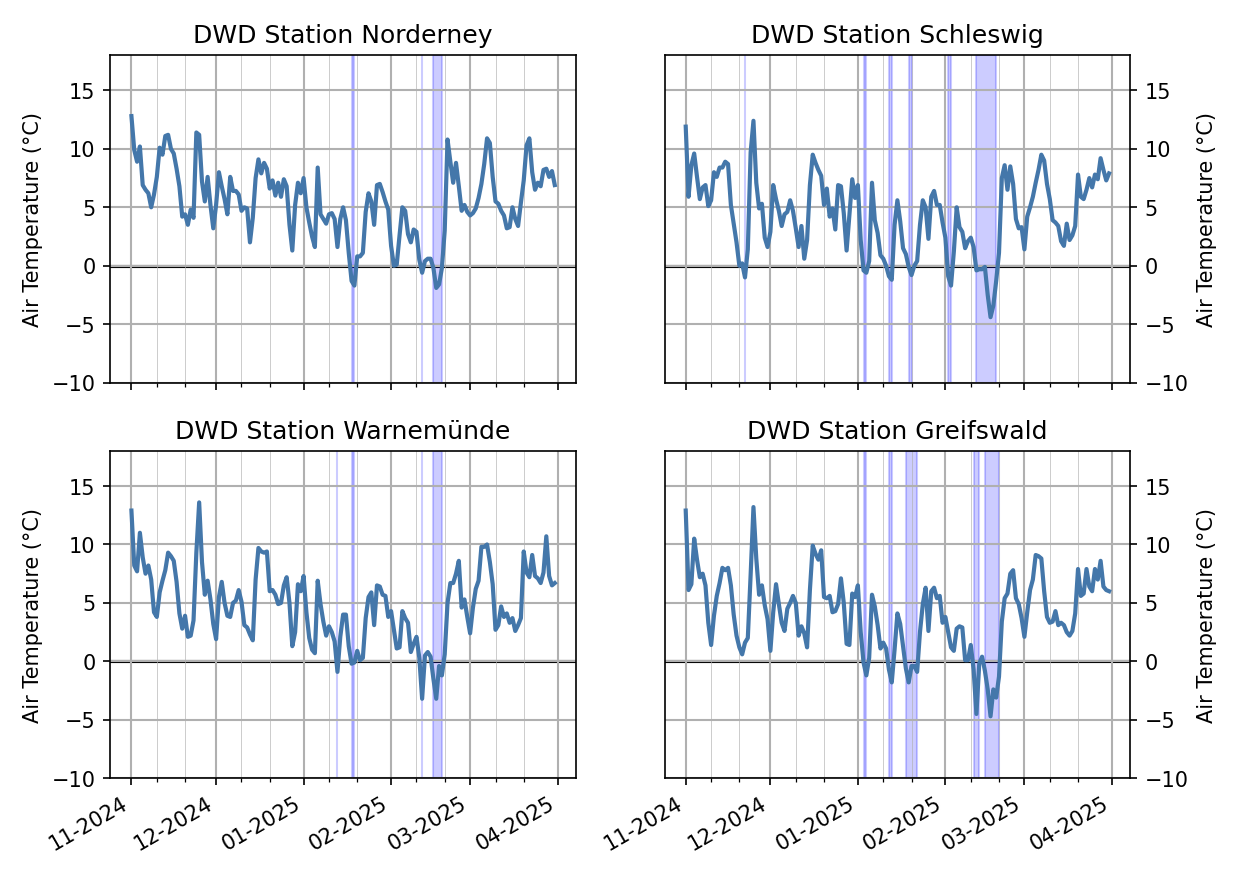
The course of the winter is shown in more detail by the daily mean air temperature at the four stations Norderney, Schleswig, Warnemünde and Greifswald in Figure 1. Throughout the winter from November to March, short warmer and colder periods alternated. However, daily mean air temparatures below 0 °C were only reached in January and February, with exception of the inland weather station Schleswig. The cold spells in January lasted only for one or two days. In mid February, a cold spell set in lasting for about a week, reasulting in air temperatures below 0 °C along the entire coast. Under influence of high pressure, cold arctic air reached the German coasts and caused moderate and, in some places, severe night frost. Continuous frost occured in places for a short time. The winter came to a quick end with a southwesterly flow bringing very mild air from southern Europe from 20 February 2025 onwards. On 21 February 2025, two-digit air temperatures were recorded on the East-Frisian Islands. The warm air spread to the north-east over the following days. No further cold spells occured for the rest of the winter.
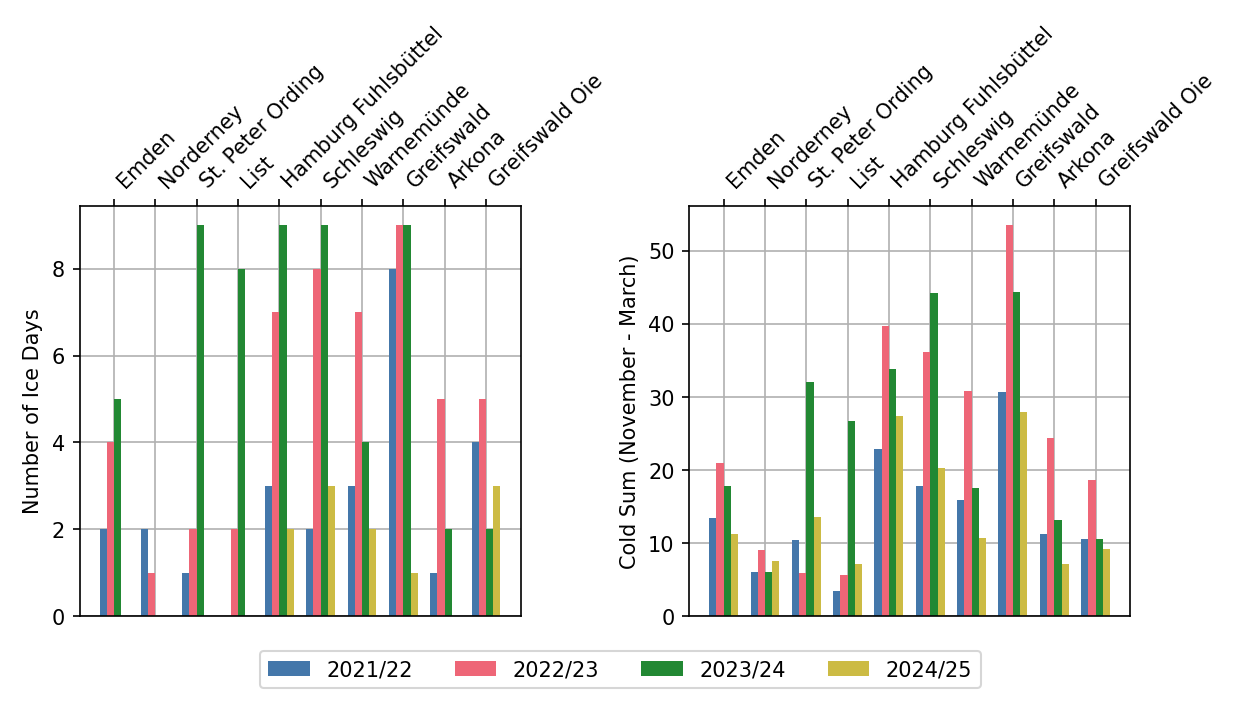
The overall mild winter is reflected in the number of ice days, days with a maximum air temperature below 0 °C, and the cold sum, sum of absolute values of the negative daily mean temperature, of the stations Emden, Norderney, List, St. Peter Ording, Hamburg Fuhlsbüttel, Schleswig, Warnemünde, Greifswald, Arkona and Greifswalder Oie for the last four winters (Figure 2). At the North Sea coast, no ice days were observed during the winter and with the exception of Norderney the cold sum was lower than the previous winter. At the Baltic Sea coast, there was a maximum of three ice days at the stations Schleswig and Greifswalder Oie and 1 to 2 ice days at the other stations except Arkona with no ice day. The number of ice days was mostly lower than in the previous three winters. The cold sum was below 30 for all stations and thus well below the limit of 100 days for mild winters. The cold sum of the eastern most stations from Warnemünde to Greifswalder Oie was lower than in the previous three winters.
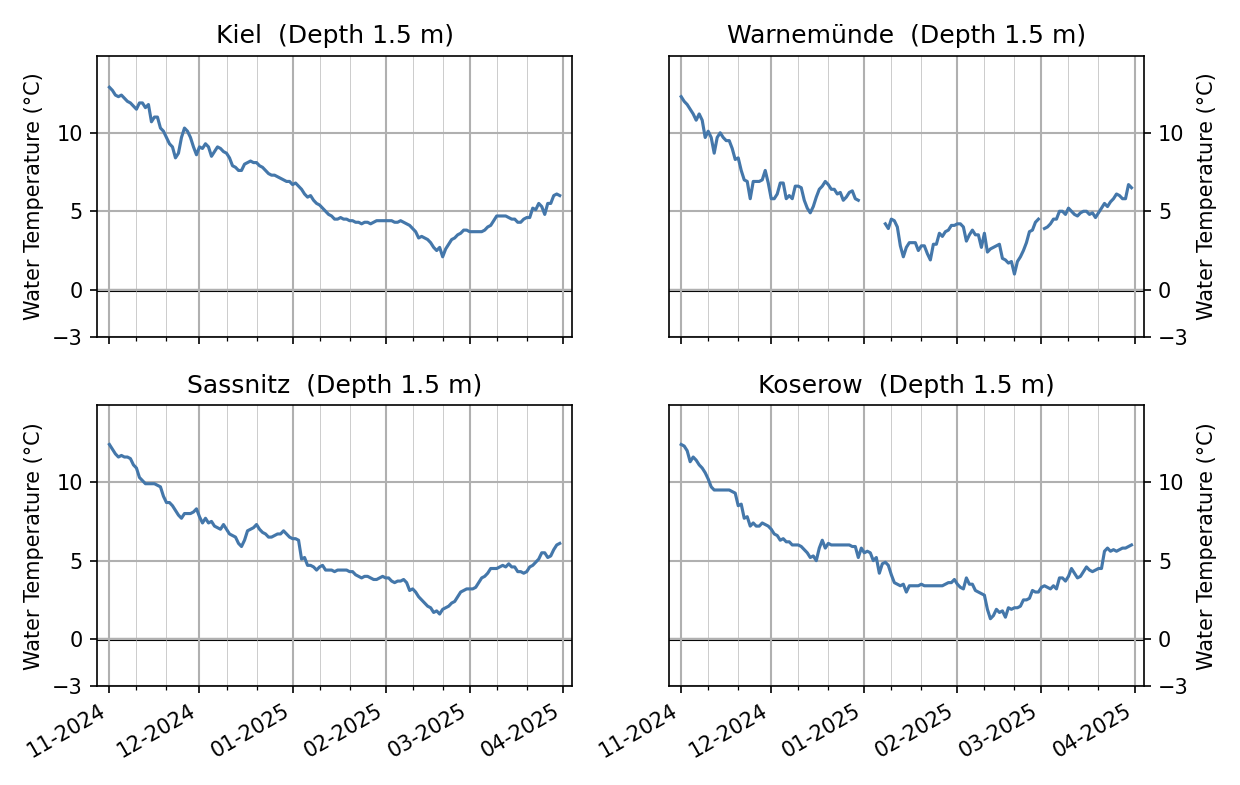
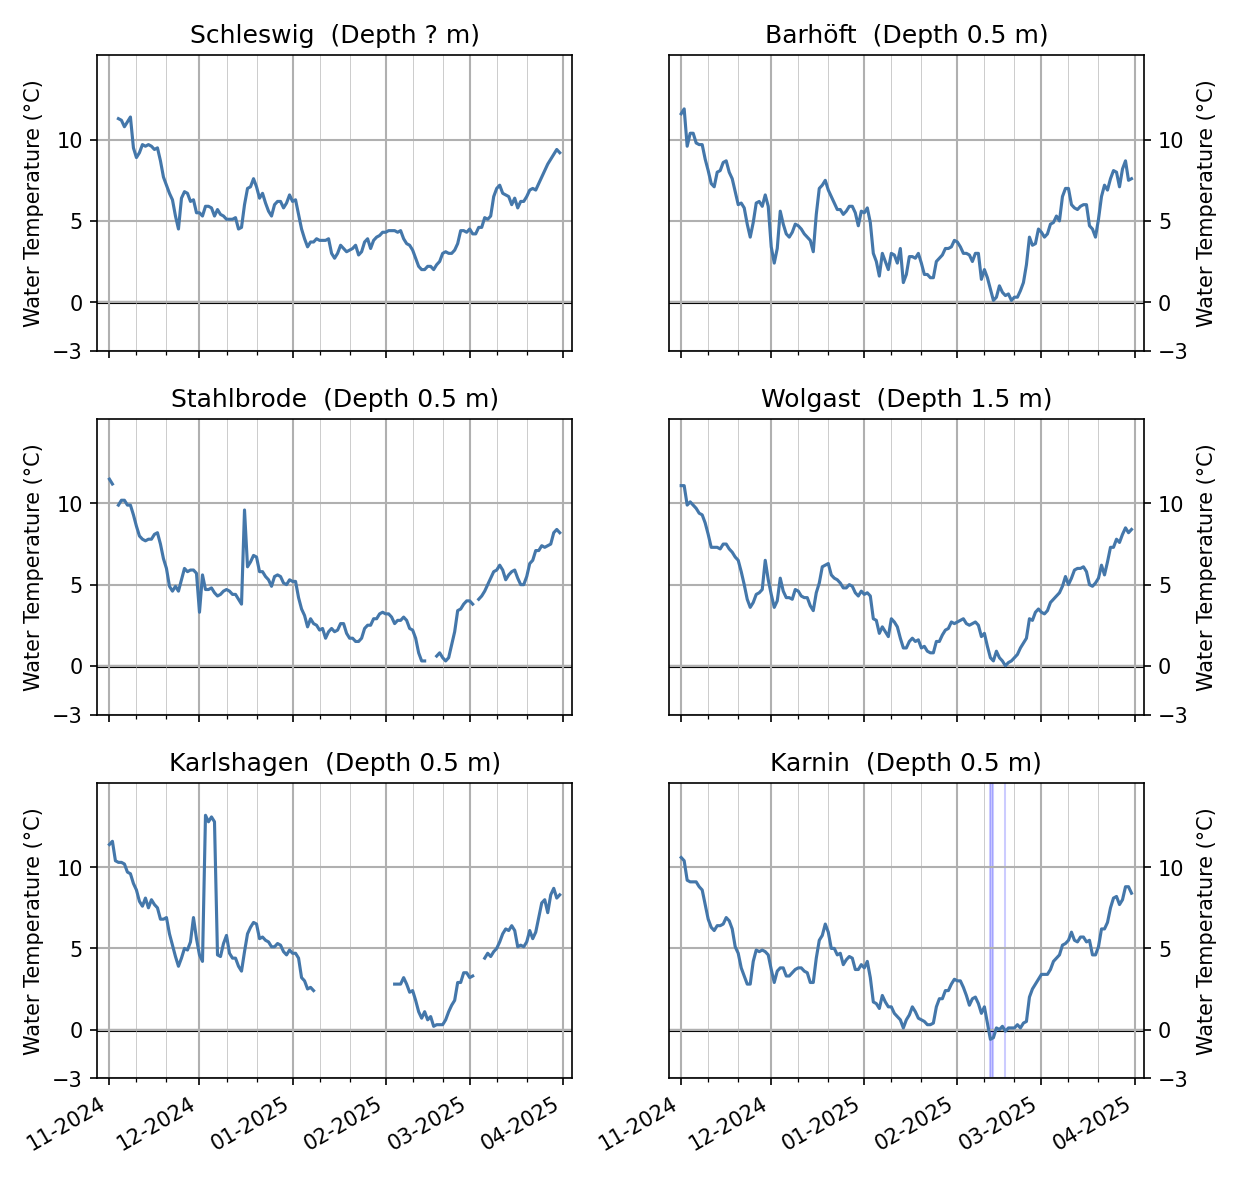
The mild winter is also reflected in the water temperatures at several stations along the North Sea and Baltic Sea coast as shown in Figure 3 to 5. At the North Sea coast (stations Norderney, Cuxhaven, Brunsbüttel and Schleuse Büsum) and the outer coast of the Baltic Sea (stations Kiel, Warnemünde, Sassnitz and Koserow), the water temperatures dropped continuously from November 2024 to mid-February 2025. Short term changes in air temperatures were not reflected in the water temperatures in 1.5 m depth. The lowest water temperatures were reached during the cold spell in February and were in the low single digit range. In the further course of the winter, the water temperatures steadily increased. In the inner waters of the Schlei (station Schleswig) and the Bodden waters (stations Barhöft, Stahlbrode, Wolgast, Karlshagen und Karnin), the water temperature decreased steadily during November. In December the water temperatures remained relatively constant but increased slightly in the second half of the month. In January, water temperatures dropped at the beginning of the month and stabilized for the rest of the month. At the change of the month water temperatures increased slightly before reaching their minimum with the cold spell mid February. Minimum water temperatures were moslty slightly above 0 °C and only dropped temporary below 0°C in Karnin. With the end of the cold spell temperatures increased quickly.

2.2 Ice conditions at the German North Sea and Baltic Sea coasts
The ice winter 2024/25 along the German coasts was a weak ice winter with only a short ice period in mid February. However in January and beginning of February sporadic ice formation occured in sheltered places along the Baltic Sea coast. During the ice period in February, ice formed in sheltered places along the Baltic Sea coast especially in the Bodden waters of the Darss and around Rügen as well as the Szczecin Lagoon, reaching thicknesses around 5 cm. Some ice fromaed locally in sheltered areas along the Schleswig-Holstein coast and on the Schlei. In the North Sea ice occurred at places in the Wadden Sea area and harbours along the North-frisian coast. No ice formed at the outer coast, eventhough the Szczecin Lagoon was largely covered by ice for a short period.
The first ice of the season in the Baltic Sea was reported on 13 January 2025 on the Schlei, the harbour of Wismar, Greifswald Ladebow harbour and the Bodden area by Dranske. However, the ice was mostly gone by the next day. Except for the Schlei, where the ice persisted for two days. In the beginning of February ice occured again at few sheltered places of the Baltic Sea coast. During the cold spell in mid February, ice formation began around 14. February 2025 along the eastern Baltic Sea coast. Along the coast of Schleswig-Holstein, ice formation started around 16 February 2025 on the Schlei and in sheltered places. Along the North Sea coast, the first ice formed around 17 February 2025.
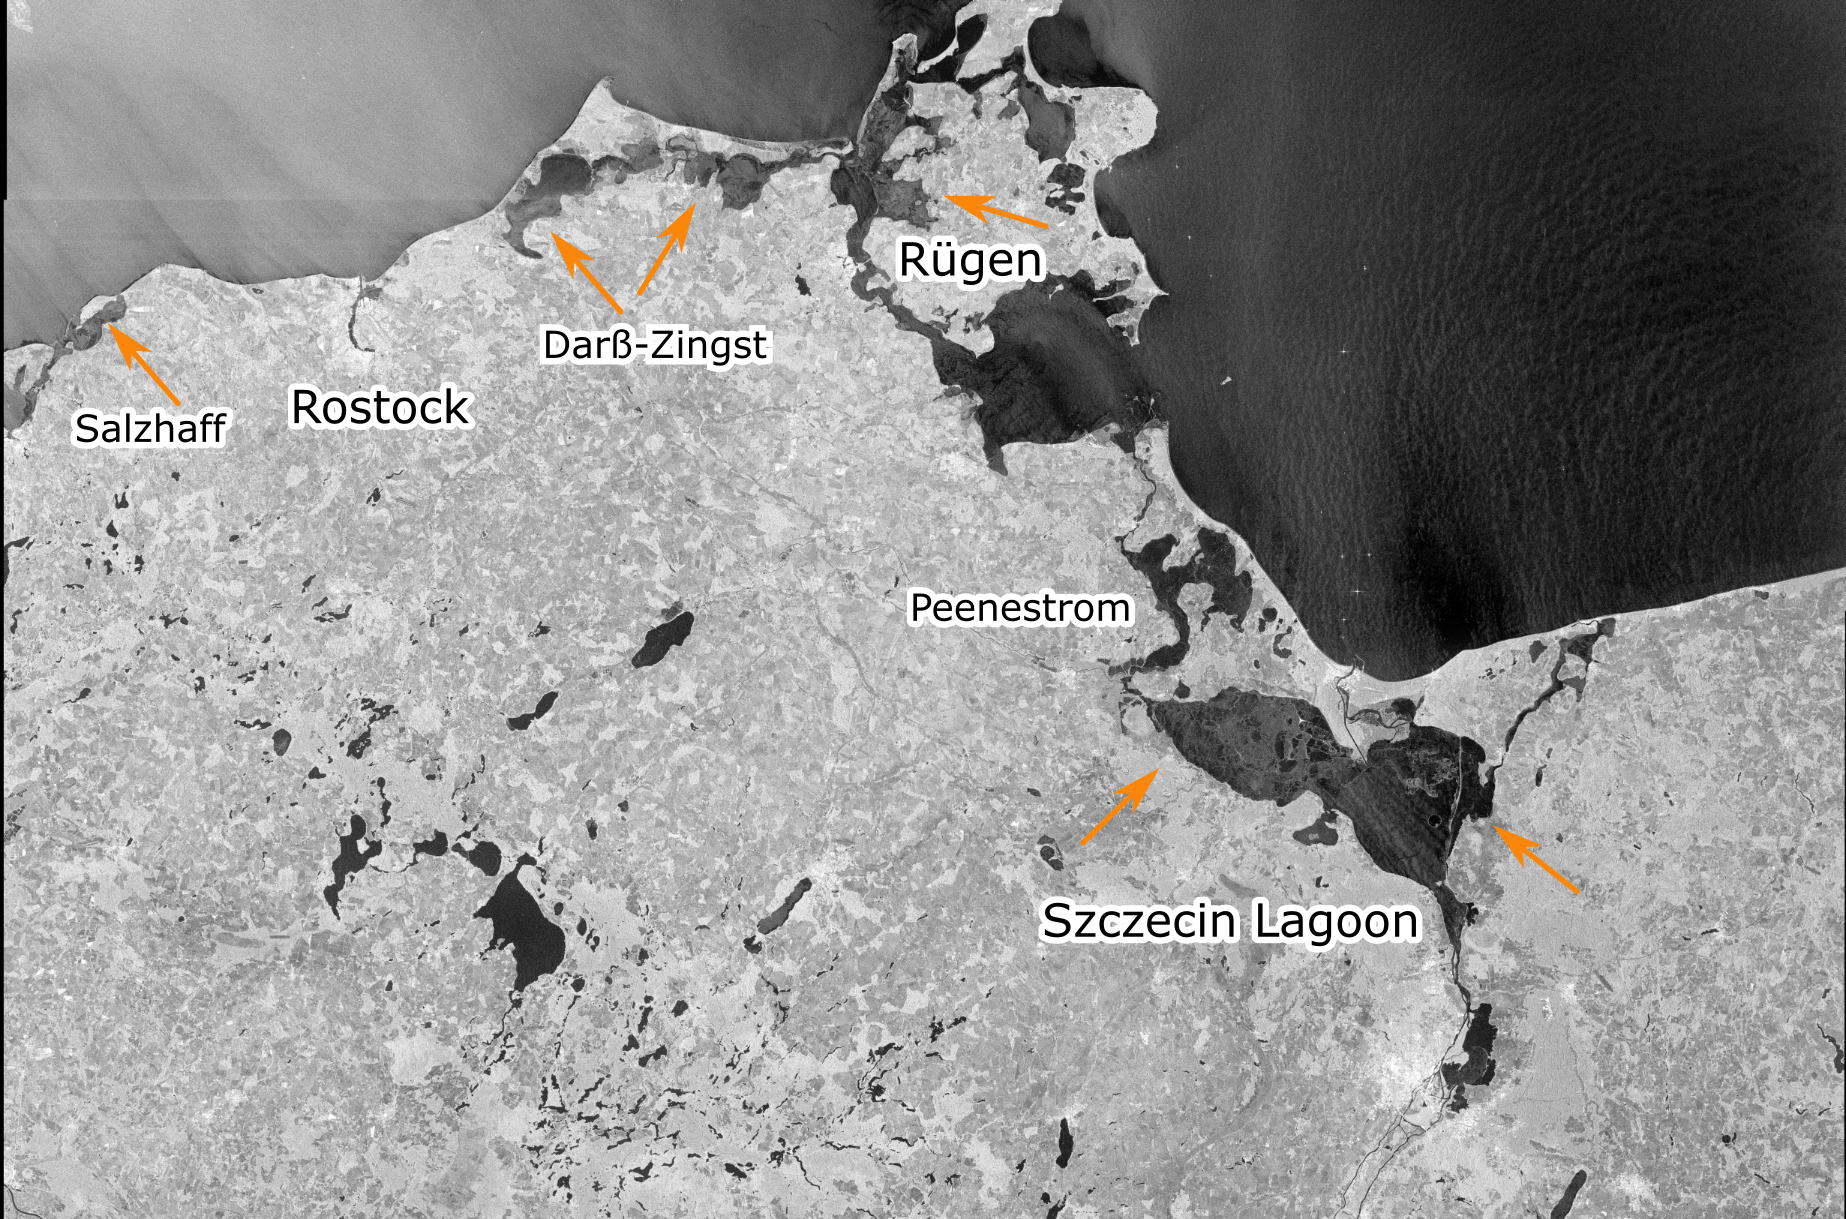
The maximum sea-ice cover was observed on 19 February 2025. At this date, ice was present in sheltered places along the North Sea and Baltig Sea coast of Schleswig-Holstein, at places in the North Frisian Wadden sea, as well as along the eastern Baltic Sea coast at the Salzhaff, the Darss-Zingst-Bodden-Chain, the western bays of Rügen, the Peenestrom and the Szczecin Lagoon. Figure 7 shows a Sentinel-1 radar image of the German coast from Wismar Bay to the Szczecin Lagoon on 19 February 2025. Ice is visible in the Salzhaff, the Darß-Zingst-Bodden-Chain, the western bays of Rügen and the Szczecin Lagoon (orange arows). Ice floes are visible in the Szczecin Lagoon as continuous dark areas. The ice shows a different texture or brightness than the surrounding water. With thin ice like in this image, it usually requires additional information, like radar images and weather information of the past days or observations of ice observers, for the decision ice or water.
The ice along the coasts vanished quickly with warm, partly two digit air temperatures starting on 20 February 2025. The North Sea was ice-free on 22 February 2025. The ice lasted longest in the western Szczin Lagoon, where the last ice was reported at the station Kamminke on 24 February 2025.
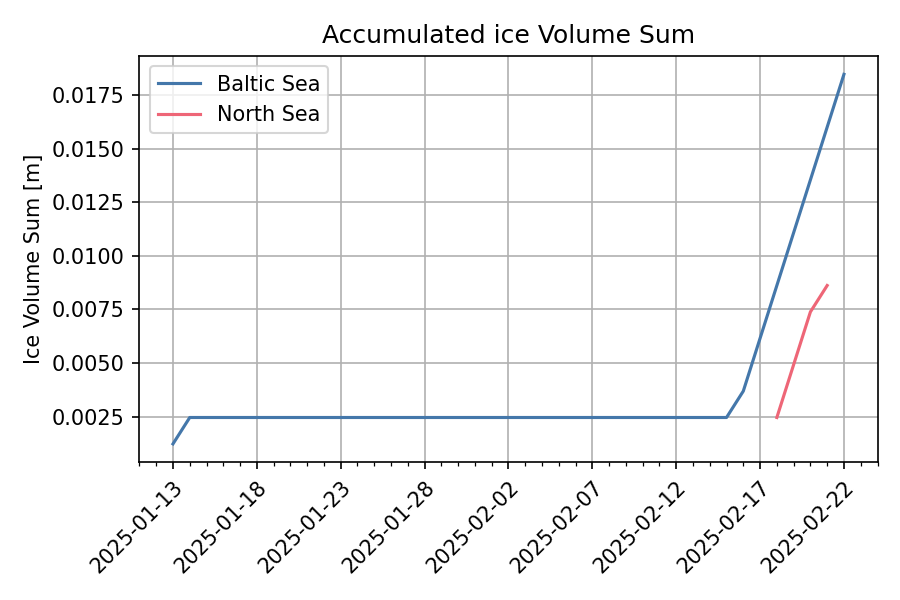
The weak ice winter is also reflected in the accumulated areal ice volume sum. The areal ice volume sum is a measure to determine the ice winter strength that depends on the ice thickness, the ice concentration and the duration of the ice occurrence [3]. The ice volume sum is calculated at 13 ice climate stations along the North Sea and Baltic Sea coast, respectively. Along the North Sea coast, the following stations are used for the calculation: Borkum/Westerems, Emden (Ems and outer harbour), Norderney/Seegat, Wangerooge/wadden, Lighthouse Hohe Weg, Brake (Weser), Helgoland, Stadersand/Elbe, Brunsbüttel, Hamburg/Landungsbrücken, Husum (harbour), Amrum/Schmaltief and Tönning (harbour). Along the Baltic Sea coast, the following stations are used: Koserow, Arkona, Landtiefrinne, Vierendehlrinne, Warnemünde/sea area, Rostock-Warnemünde, Walfisch-Timmendorf, Travemünde-Lübeck, Marienleuchte/sea area, Westermarkelsdorf/sea area, Eckernförde (harbour), Schleimünde-Schleswig and Flensburg-Holnis.In the winter 2024/25 ice was only reported for the stations Schleimünde - Schleswig and Rostock - Warnemünde for the Baltic Sea coast. At the North Sea, ice was observed at the stations Amrum Schmaltief and Tönning, Hafen. The accumulated ice volume sum is shown in Figure 8. The short ice occurrence in the Schlei in January and the ice period in February are visible.
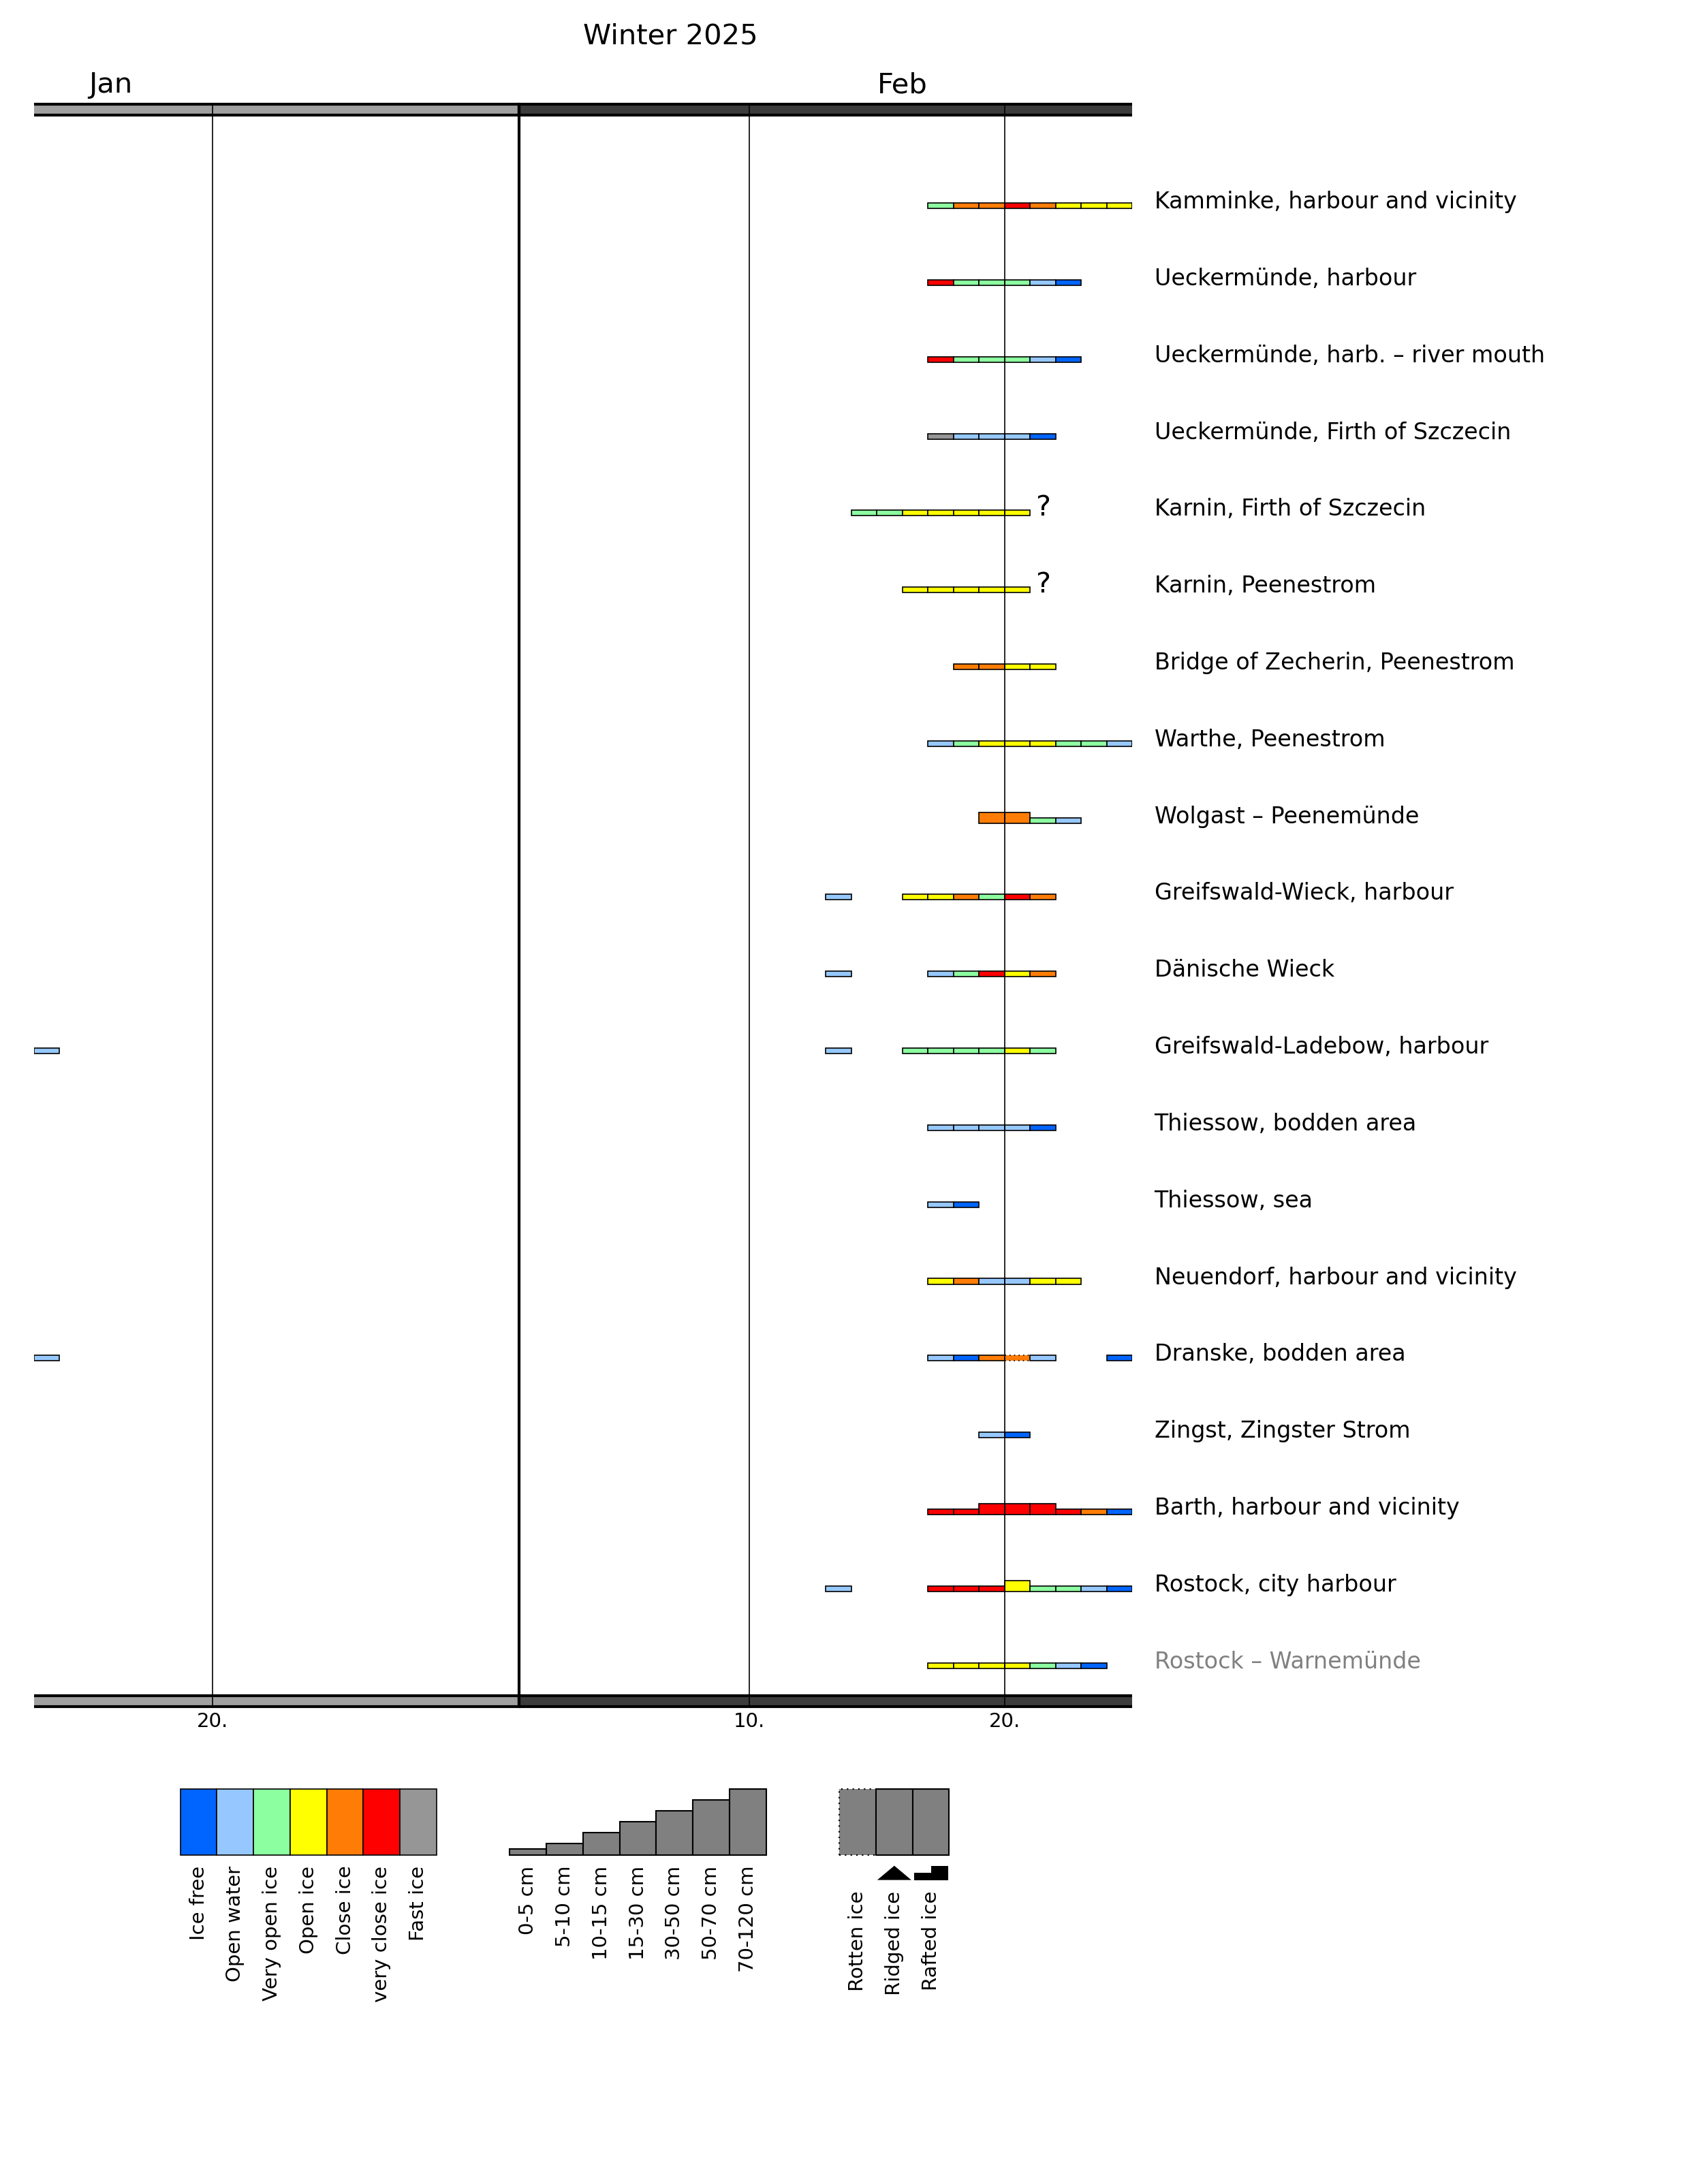
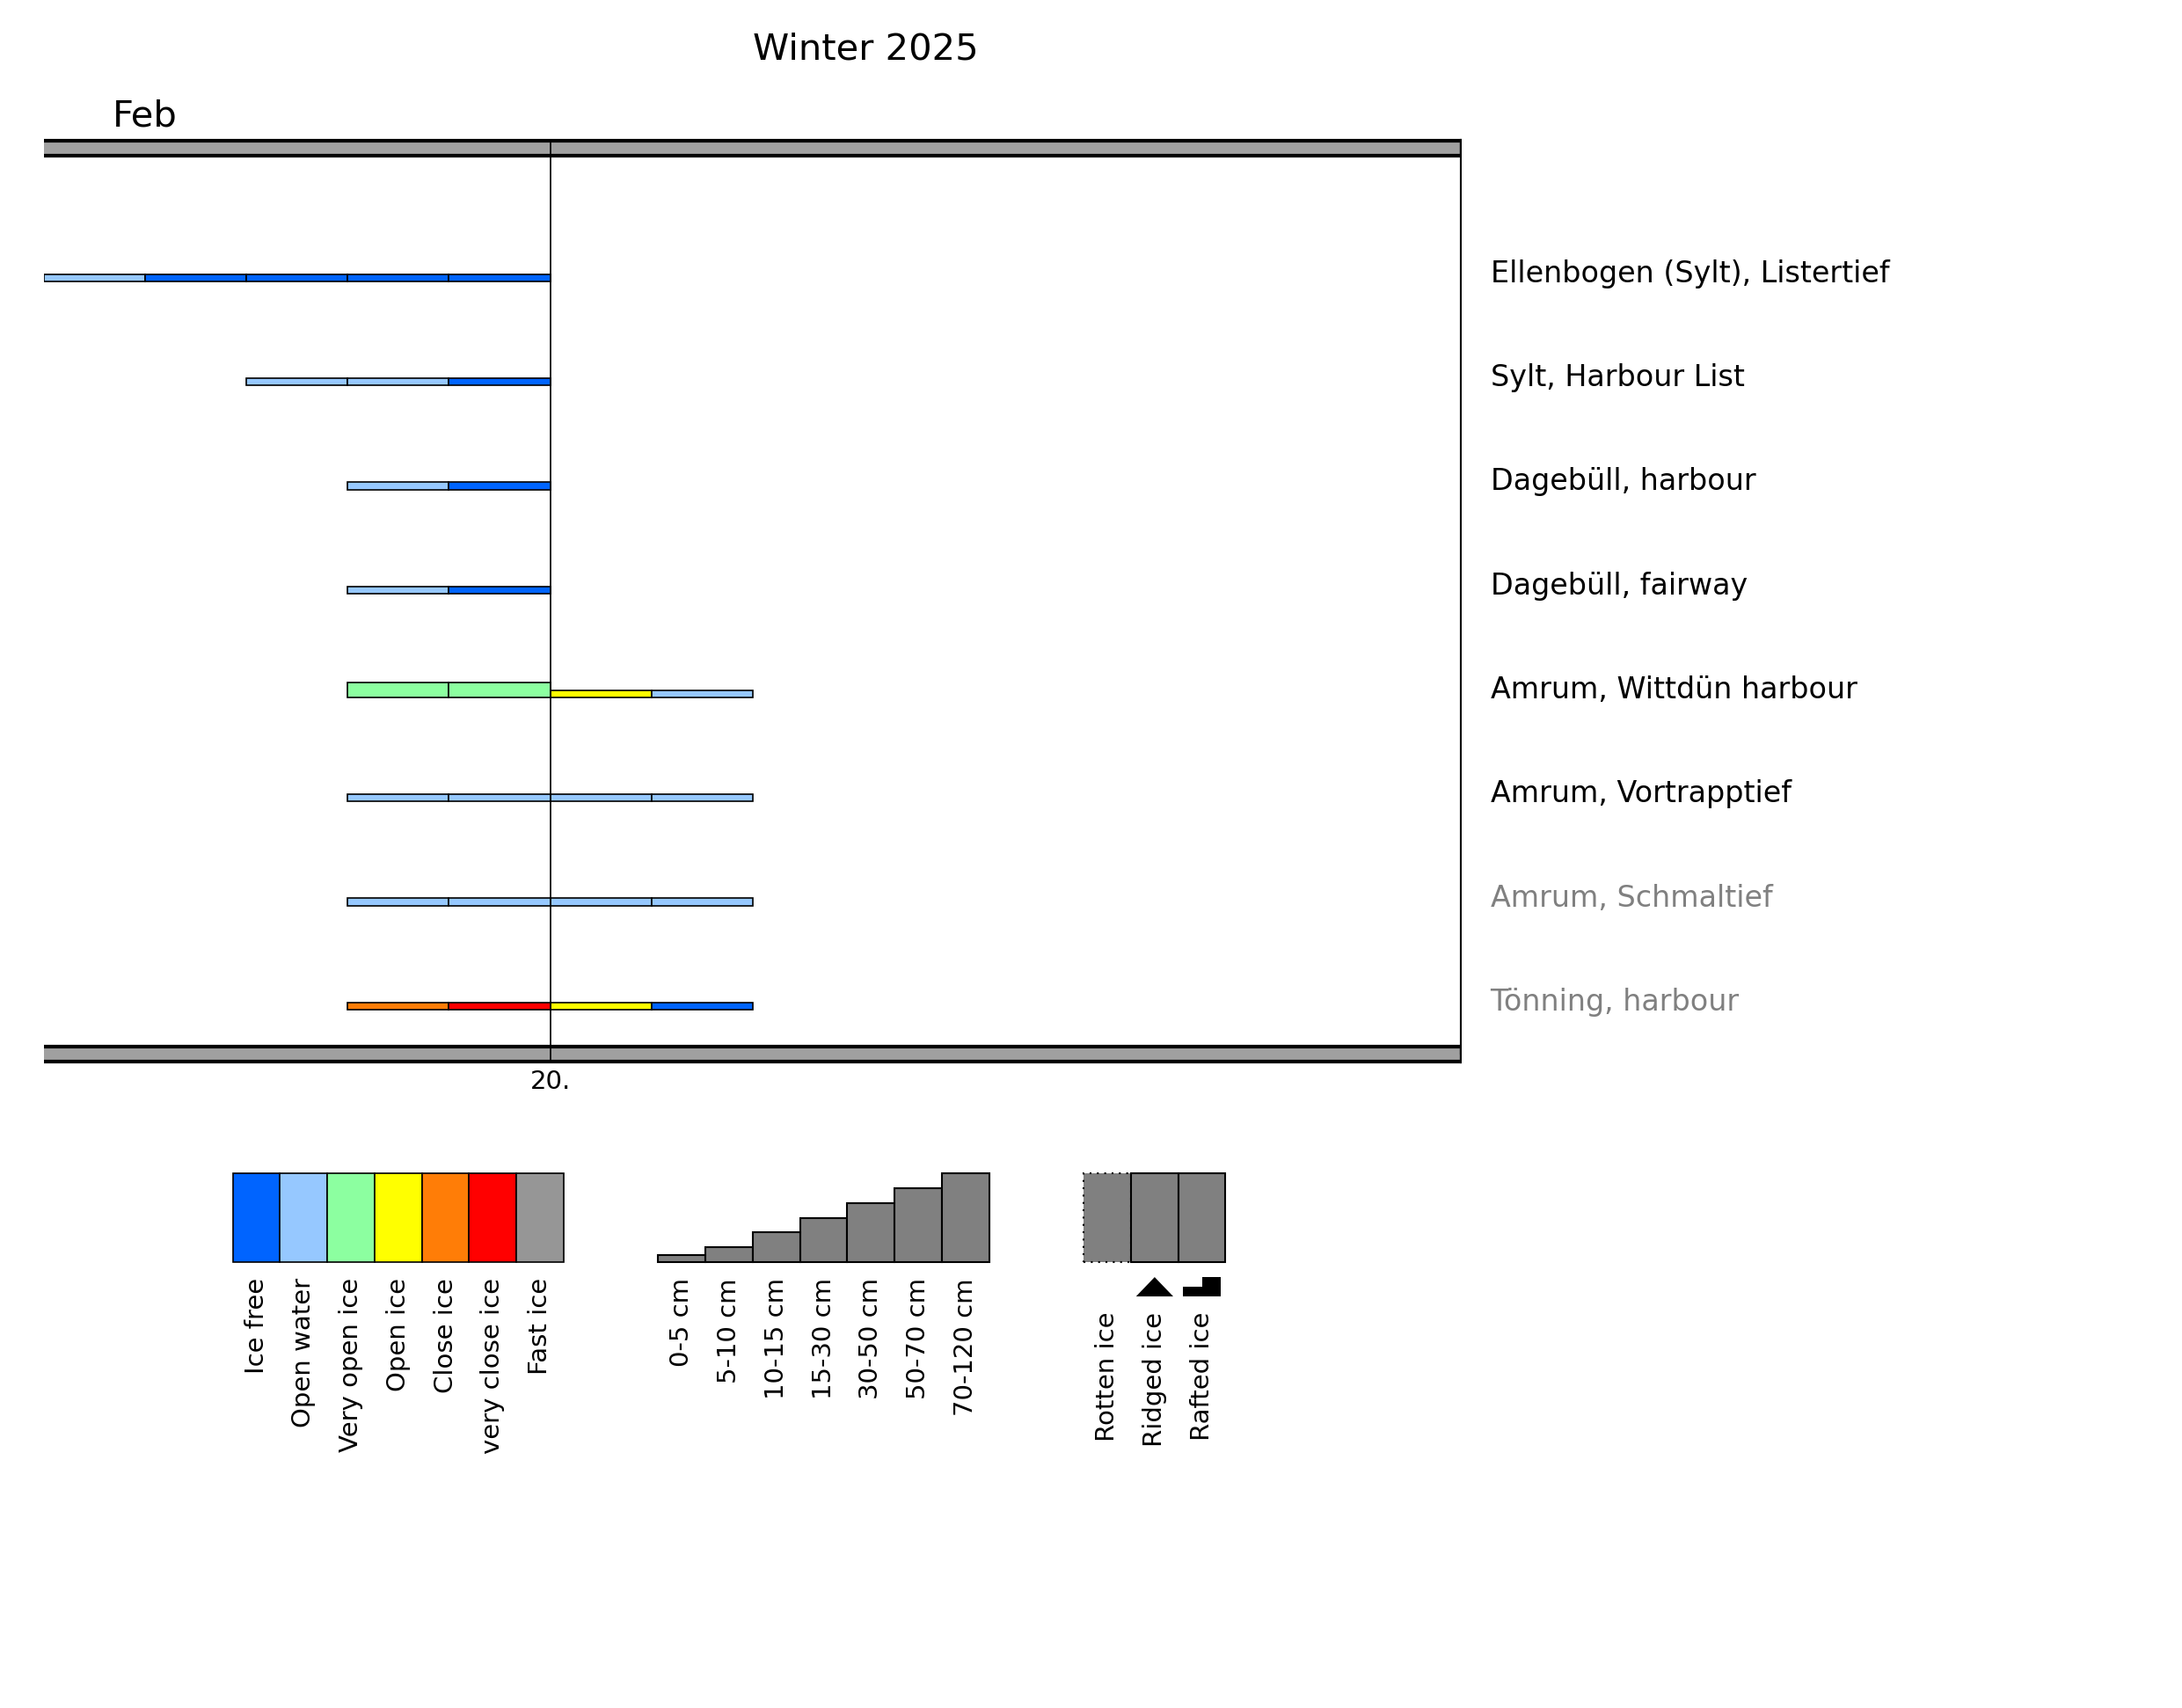
A total of 37 stations reported ice in the winter 2024/25; eight along the North Sea coast and 29 along the Baltic Sea coast. A maximum ice thickness of 7 cm was measured in the harbour of Barth in the Darß-Zingst-Bodden-Chain. Most days with ice in the Baltic Sea were observed in the Schlei and in the harbour of Wismar, with 9 days. In the North Sea, ice was reported for a maximum of four days at the island of Amrum. An overview of the statistics and ice observations of all ice observing stations is shown in the appendices A und B.
2.3 Navigational conditions at the North Sea and Baltic Sea coasts
Navigation was not noteworthy impeded along the German coasts in the winter 2024/25 due to the short freezing periods and therefore thin ice thickness. In some harbours a thin ice cover was broken up by the ship traffic.
2.4 Ice winter severity
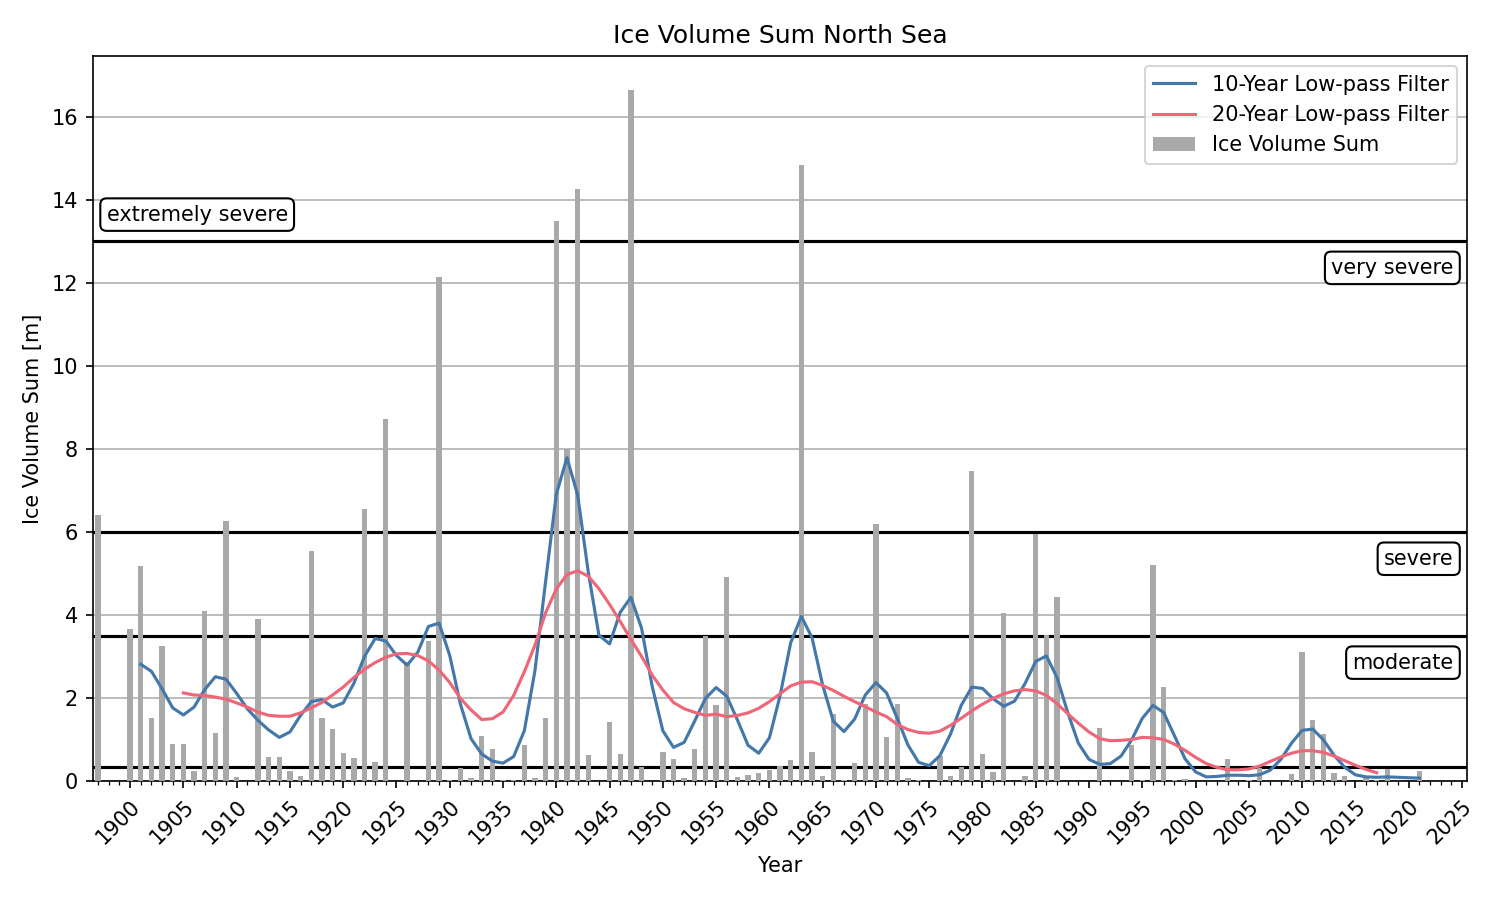
The ice winter severity along the German coasts is determined by the accumulated areal ice volume sum of 13 ice climate stations for the North Sea and Blatic Sea (see 2.2). The ice winters are than classified in five categories: weak, moderate, severe, very severe and extremely severe. The accumulated ice volume sum in the winter 2024/25 is shown in Figure 8. With an accumulated ice volume sum of 0.02 m and 0,01 m along the Baltic Sea coast and North Sea coast respectively, the ice winters at both coasts were weak ice winters. They were the thirteenths weak ice winters in a row along the German coasts. Figure 9 shows the accumulated ice volume sum at the German Baltic Sea coast since the winter 1879. Over the entire 147 winters, 15 winters were equal or weaker and 131 winters stronger than the winter 2024/25. Since 2010 no severe winter occurred and the last very severe winter was in 1996.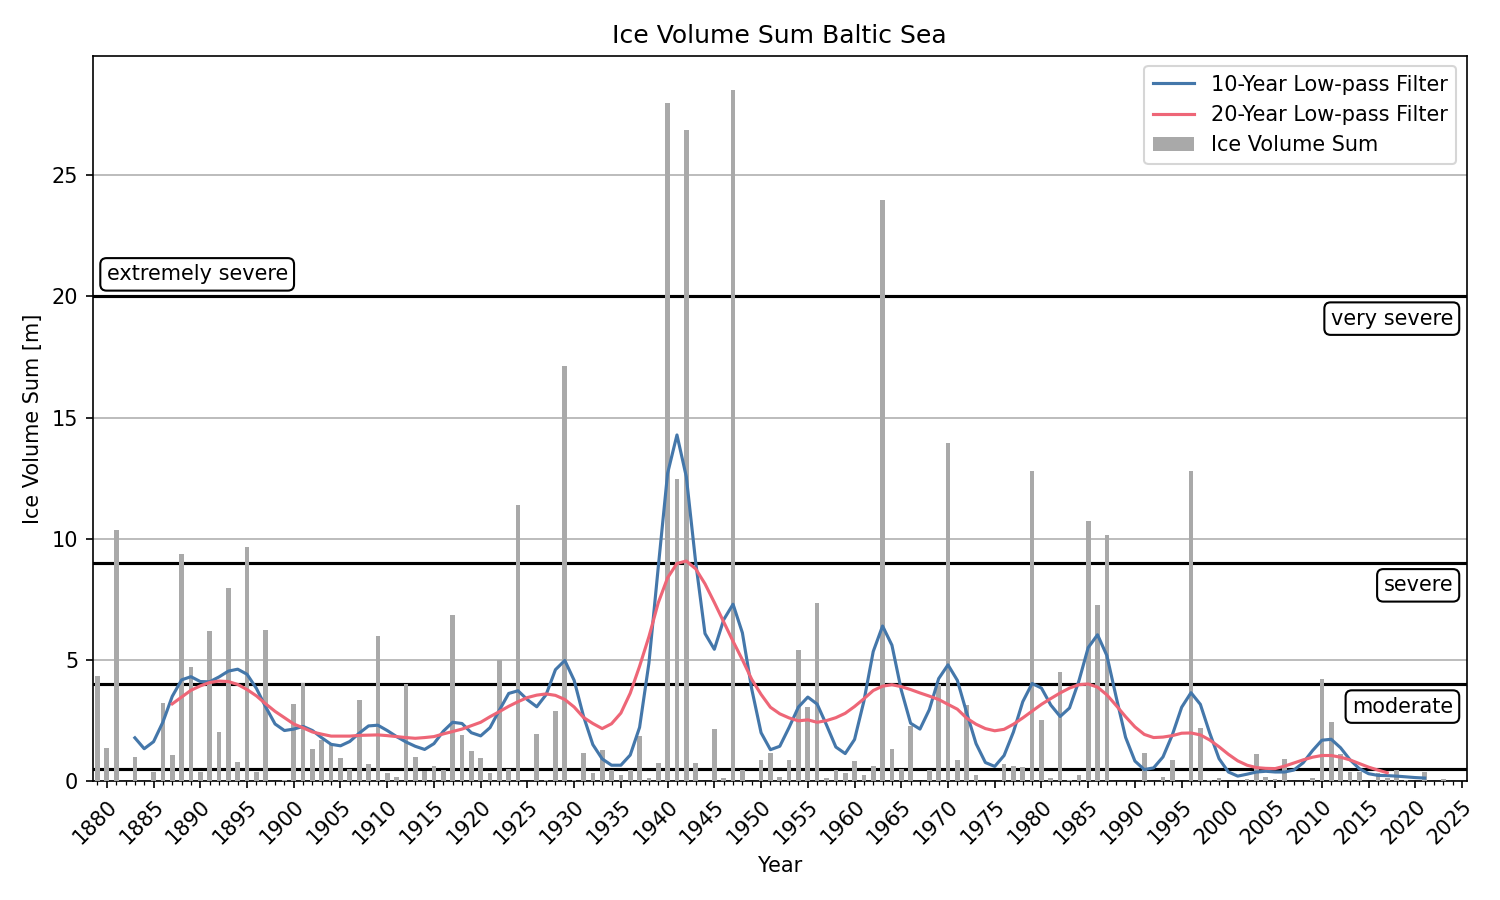
3 Ice conditions in the western and southern Baltic Sea, Kattegat and Skagerrak
In the Skagerrak and Kattegat ice occurred only in sheltered areas and in the inner archipelagos along the coast during the course of the winter. Ice formation started around mid December 2024 at places along the Norwegian coast. Beginning of January some ice formed along the northern Swedish coast. With the cold spell in mid February ice formation started in sheltered places along the Swedish coast to Karlskrona and along the Danish coasts. Most of the ice was gone by the end of Ferbuary with the warmer weather. In few Norwegian bays ice stayed until the end of March. In the Vistula Lagoon and the Curonian Lagoon, the first ice formed with the cold spell in February. Both Lagoons were covered with ice for a short period but the ice was gone beginning of March. No further ice formation occured for the rest of the winter.
4 Ice conditions in the northern Baltic Sea
The ice winter in the northern Baltic Sea was mostly shorter than usual and only the Bay of Bothnia was covered by ice for a short period of time. In the Bothnian Sea and the Gulf of Finland, hardly any ice formed outside the coasts. Else, ice only formed in sheltered places along the coast. In terms of the maximum ice extent the ice winter 2024/25 was a weak ice winter. Strong, south-westerly winds repeatedly pushed the ice pack in the Bay of Bothnia together and caused difficult navigation conditions at times along the Finnish coast.
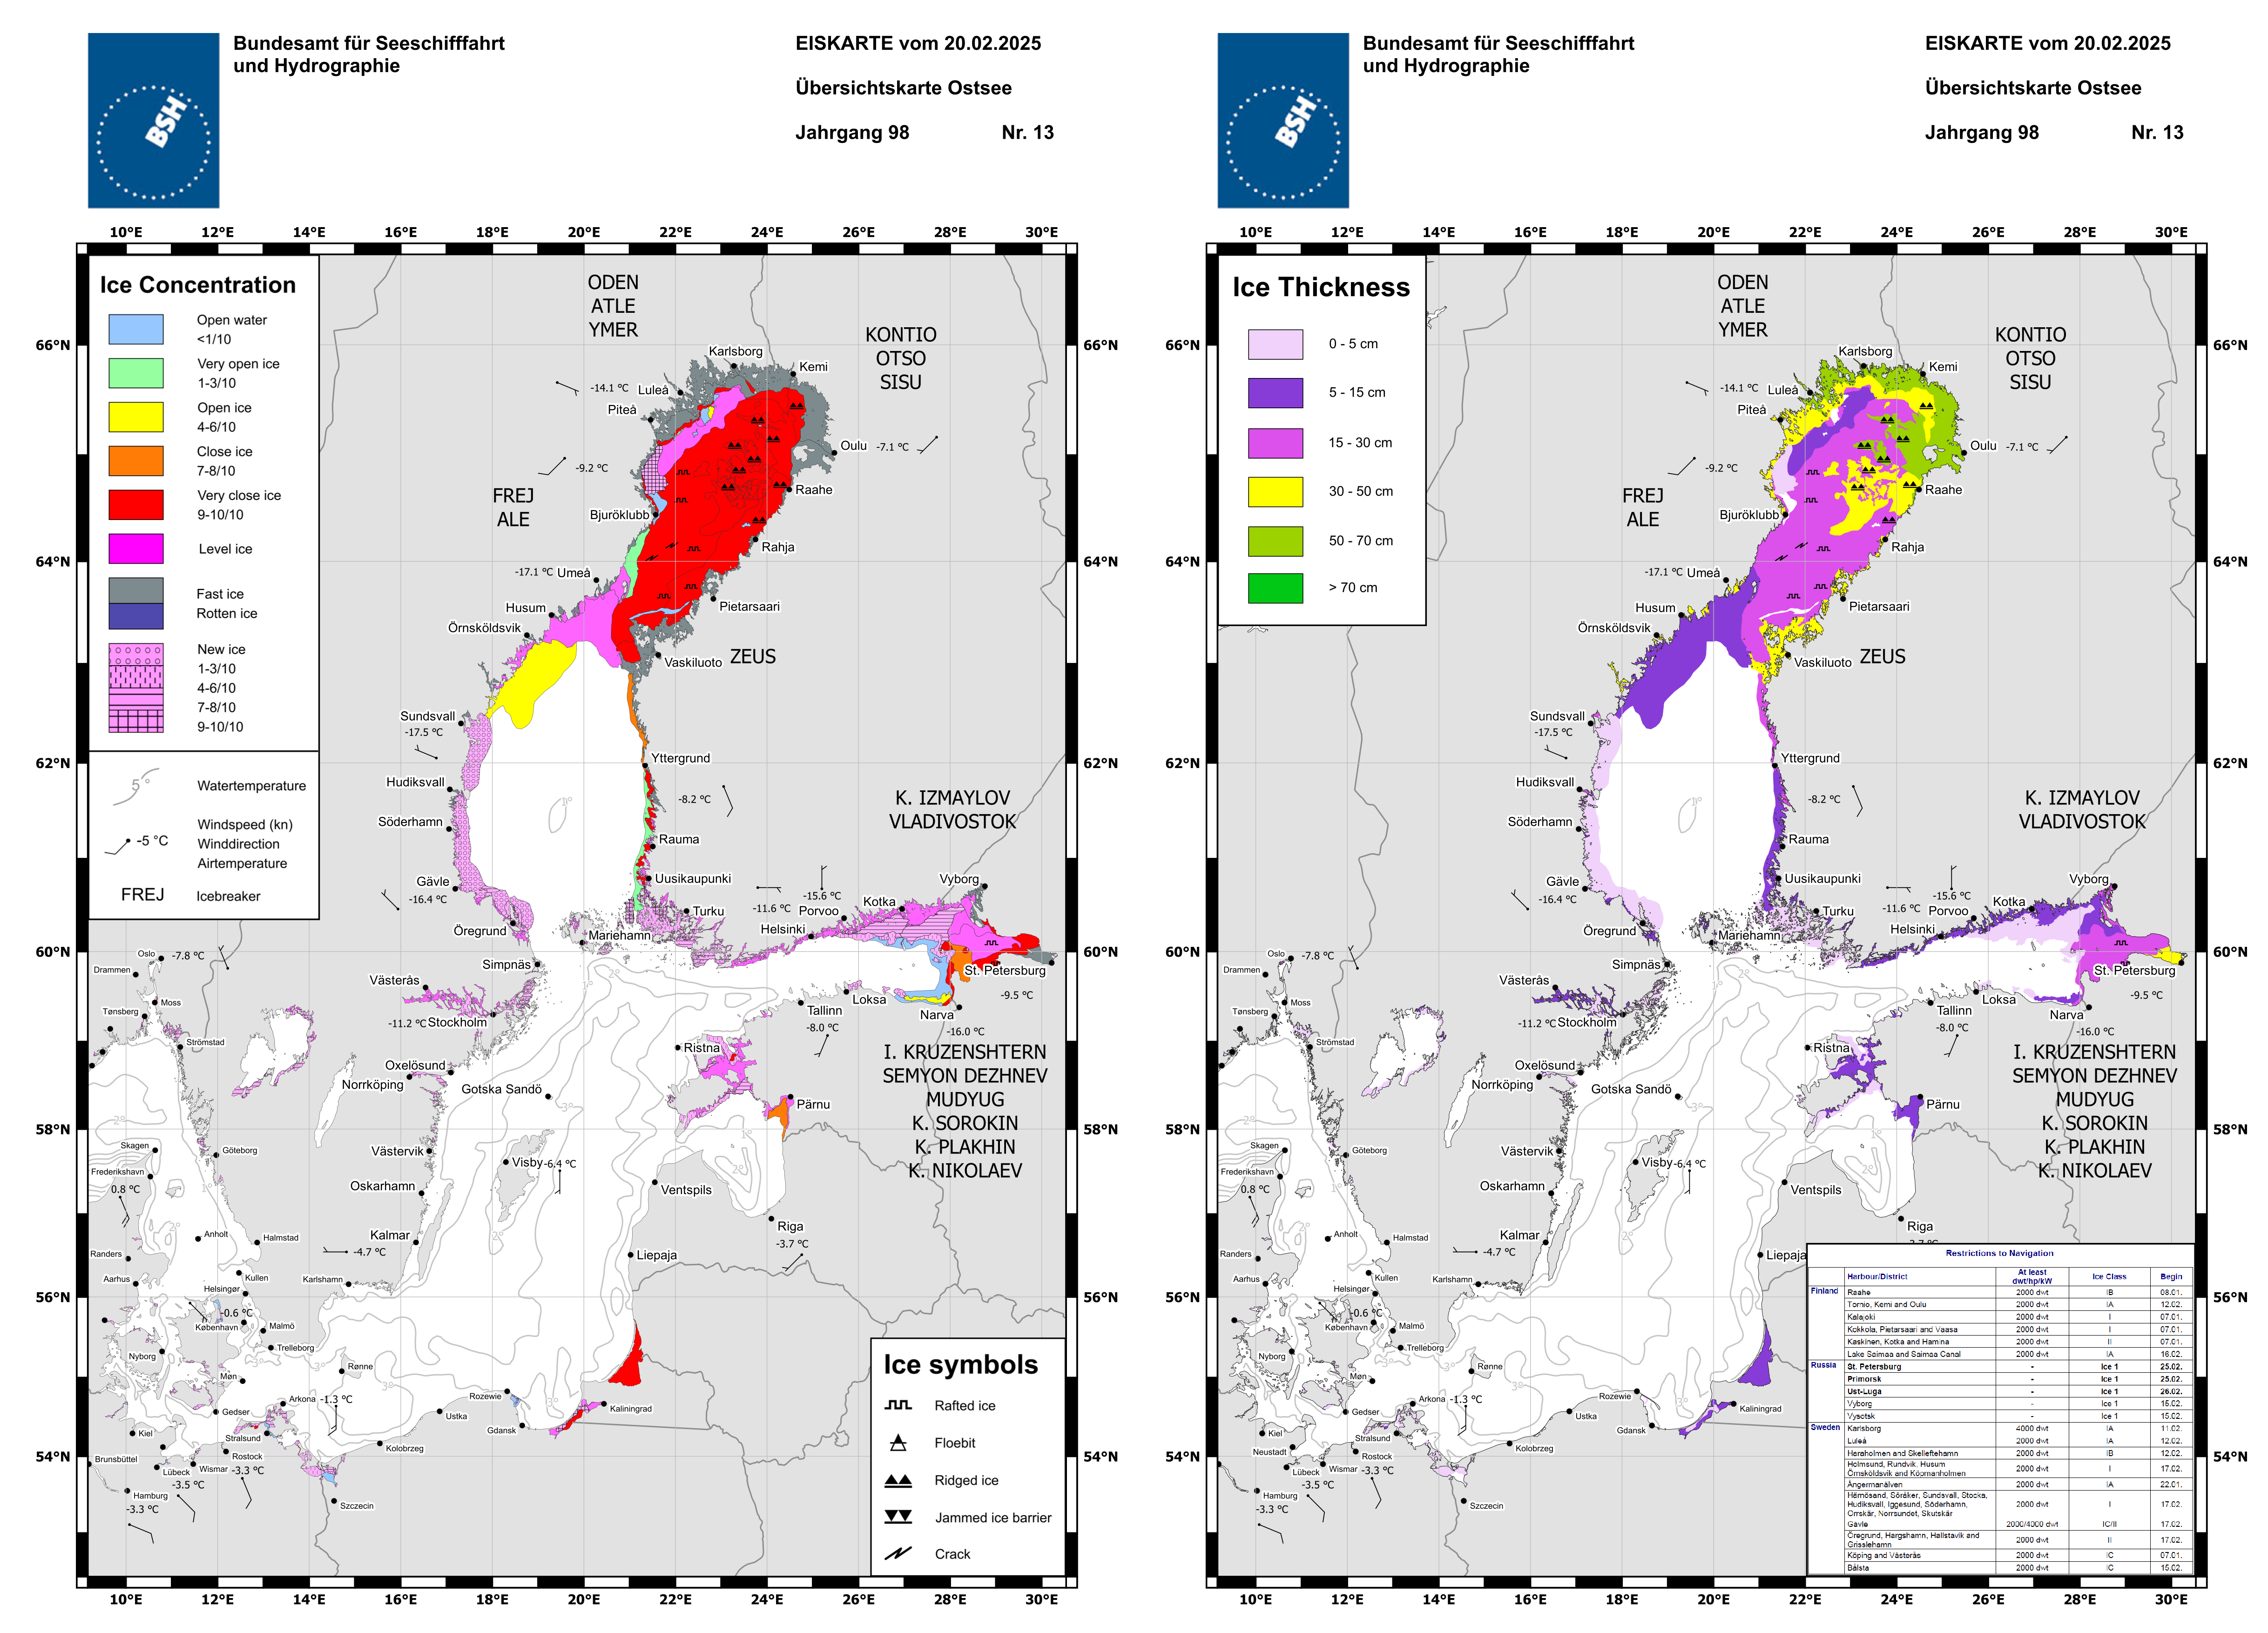
The first ice formed in the beginning of November 2024 in the Bay of Bothnia, but ice formation spread very slowly southwards to the Quark due to mild weather. During the first half of December 2024 ice formation started in sheltered places in the Bothnian Sea, the Archipelago Sea, the Aland Sea and the eastern Gulf of Finland as well as at places in the northern Gulf of Riga and lake Mälaren. As December progressed, ice formed at sea in the northern Bay of Bothnia and ice formation continued along the coasts further south. Beginning of January the overall sea-ice cover increased and ice formation extended further south along the northern Gulf of Finland and in the Northern Baltic Sea. The total ice cover fluctuated until February but did not increase significantly. Ice at sea only formed in the northern Bay of Bothnia. With the cold spell in mid-February the sea-ice cover significantly increased and ice formed at sea in the Bay of Bothnia and the Quark as well as for a short period of time in the northern Bothnian Sea and the eastern Gulf of Finland. For the first time the Bay of Bothnia was completely covered with ice on 15 February 2025, and maximum ice extent was reached on 20 February 2025. Figure 11 shows the BSH ice chart from 20 February 2025.
As March progressed, the ice cover in the northern Baltic Sea, the Gulf of Riga, the Åland Sea and the Archipelago Sea rapidly decreased, and these areas were largely ice-free by mid-March. The ice cover also decreased quickly in the Gulf of Finland, the Bothnian Sea and the Quark. The Gulf of Finland and the southern Bothnian Sea were ice-free at the beginning of April. In the northern Bothnian Sea and the Quark remnants of rotten ice remained until mid-April. In the Bay of Bothnia, the thicker drift ice at sea was mostly located east of the Line Kalajoki to Lulea during March and April. In mid-March, new ice and thin, level ice formed at sea to the Quark, but vanished quickly or drifted to northeast. Recurring srong winds from southwest compressed the sea ice in the northeastern Bay of Bothnia, making navigation in the ice difficult at times. In the last third of April, the fast ice in the northern Bay of Bothnia started to become rotten and the ice at sea decreased continuously. The last remnants of rotten fast ice along the northern coast melted by mid-May while some drift ice remained off the coast from Kalajoki to Raahe. The ice decreased continuously and drifted slightly southward. The last ice melted 23 May 2025 off Kalajoki.
The fast ice in the Bay of Bothnia reached a maximum thickness of about 80 cm. Further south, in Norra Kvarken and the northern Bothnian Sea the fast ice was up to 50 cm thick. In the southern Bothnian Sea and the Gulf of Finland the fast ice was 5 to 35 cm thick. At sea, the drift ice the northern Bay of Bothnia was a maximum of 70 cm thick while only thin ice formed in Norra Kvarken, the northern Bothnian Sea and the eastern Gulf of Finland.
The course of the ice winter is also evident in the sea ice extent from the BSH ice charts in Figure 12.
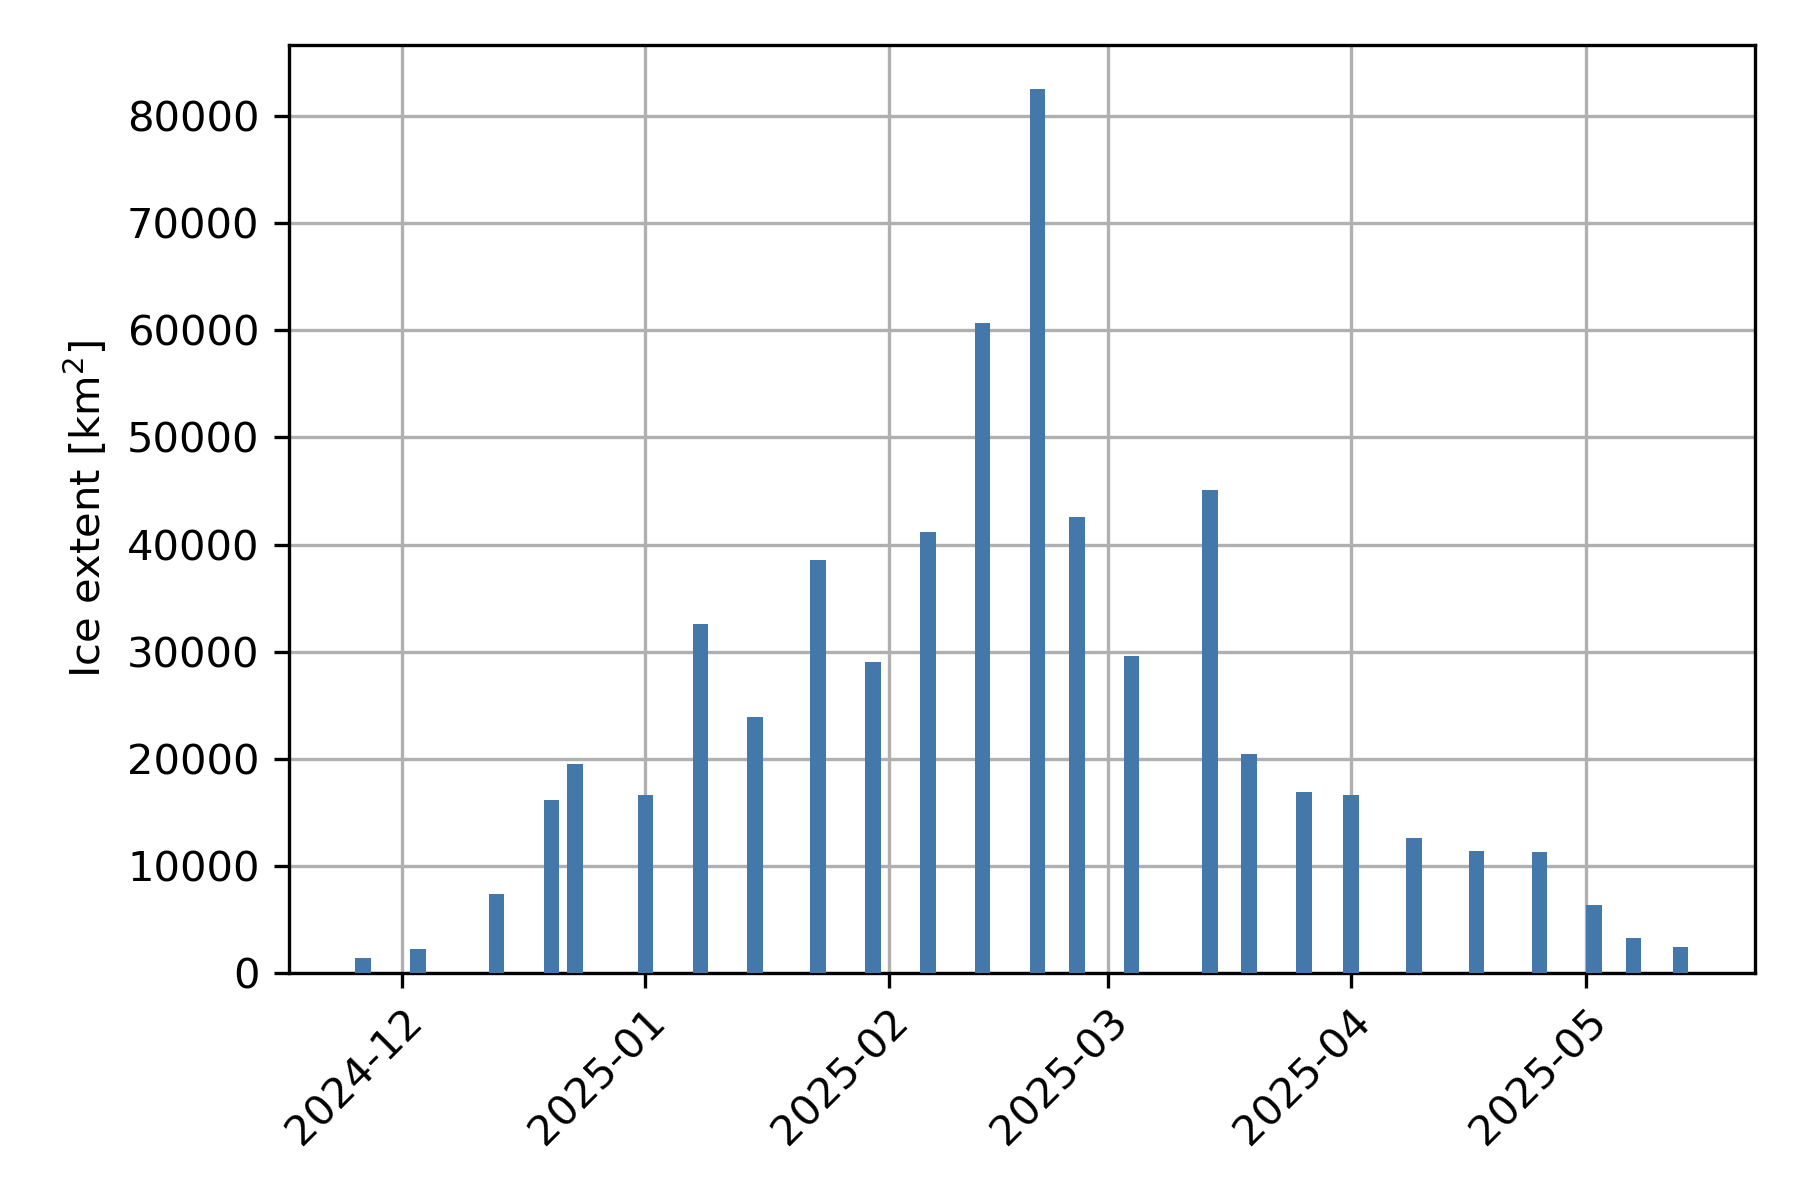
The maximum ice extent in February and the subsequent rapid decline in sea ice cover are clearly visible. The short periods of warmer weather and southwesterly winds from January to March are reflected in the often week to week changes of the sea ice extent. In mid-March was a short-term increase in sea ice extent before it declined steadily.
Restrictions for navigation were in force from 07 November 2024 to 18 May 2025 in the northern Bay of Bothnia. At times there were also restrictions in place in the Bothnian Sea, the Åland Sea, the Archipelago Sea, the Gulf of Finland, the Gulf of Riga and Lake Mälaren as well as, for a short time, along the Swedish coast to Norrköping and in Lake Vänern.5 The ice winter 2024/25 in long-term comparison
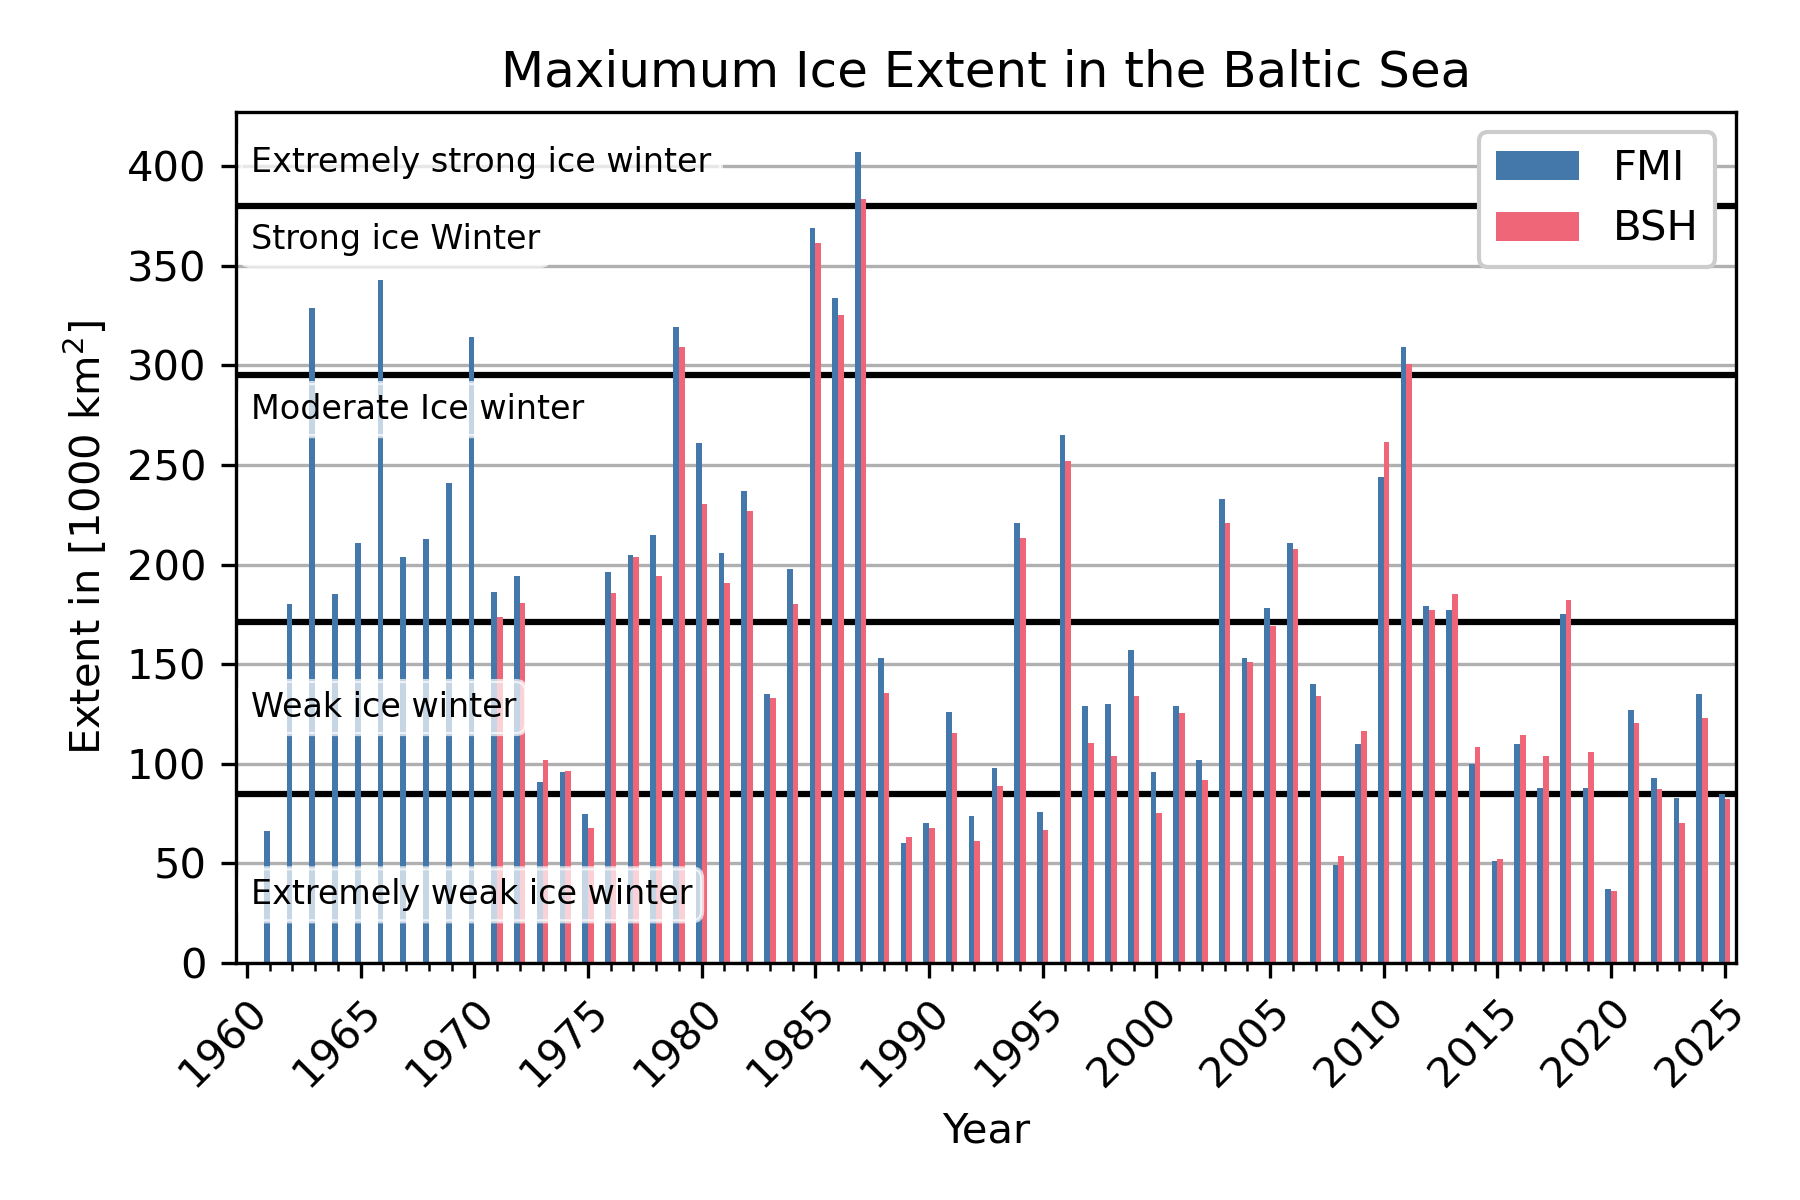
The strength of the ice winter of the Baltic Sea is determined by the maximum ice extent. A maximum ice extent of 82509 km2 was measured in the weekly ice charts of the BSH on 20 February 2025. The Swedish/Finnish ice charts showed a maximum of 85000 km2 on 20 February 2025. Systematic deviations arise from the subjective interpretation of the underlying satellite images and various ice data, differences in the calculation of ice extent, and different land masks.The classification of the ice winter in five categories from extreme weak to extreme strong is done according to the method of Nusser [4]. The ice winter 2024/25 was an extremely weak ice winter according to this classification. In a three-part classification (mild, normal, severe) from the Swedish and Finnish ice services it was a mild ice winter (< 115000km2). A time series of the maximum ice extent from the Finnish ice service and the BSH since 1961 is shown in Figure 13. The maximum ice extent of both services follows the same trend but there are differences in the values due to above discussed reasons.
6 Reporting of the BSH
The BSH informed about ice conditions and expected ice development in the entire Baltic Sea and German coastal waters by the following reports and ice charts:
The weekly report with a review and an outlook of the ice situation in the Baltic as well as with a glimpse of the ice situation at the poles is issued weekly throughout the year since 2022.
Bibliography
- Deutscher Wetterdienst (2024, 28. Februar), Deutschlandwetter im Winter 2023/24 [Pressemitteilung], https://www.dwd.de/DE/presse/pressemitteilungen/DE/2024/20240228_deutschlandwetter_winter2023-2024_news.html
- Deutscher Wetterdienst, Die Witterung in den deutschen Küstengebieten, https://www.dwd.de/DE/leistungen/witterungkueste/witterungkueste.html
- Koslowski, G., 1989: Die flächenbezogene Eisvolumensumme, eine neue Maßzahl für die Bewertung des Eiswinters an der Ostseeküste Schleswig-Holsteins und ihr Zusammenhang mit dem Charakter des meteorologischen Winters. Dt. hydrogr. Z. 42, 61-80
- Nusser, F., 1948: Die Eisverhältnisse des Winters 1947/48 an den deutschen Küsten. Dt. hydrogr. Z. 1, 149–156
Appendix
A. Ice conditions at the German coasts
| Begin | End | Days with ice | max.
ice thickness [cm] (Measurement) |
max.
ice thickness [cm]* (Baltic Sea ice code) |
|
|---|---|---|---|---|---|
| Barth, harbour and vicinity | 17.02. | 23.02. | 7 | 7.0 | 10 |
| Bridge of Zecherin, Peenestrom | 18.02. | 21.02. | 4 | 3.0 | 5 |
| Dranske, bodden area | 13.01. | 21.02. | 5 | — | 5 |
| Dänische Wieck | 13.02. | 21.02. | 6 | 1.0 | 5 |
| Eckernförde, harbour | 17.02. | 19.02. | 3 | 5.0 | 5 |
| Greifswald-Ladebow, harbour | 13.01. | 21.02. | 8 | 1.0 | 5 |
| Greifswald-Wieck, harbour | 13.02. | 21.02. | 7 | 2.0 | 5 |
| Heiligenhafen, harbour | 17.02. | 19.02. | 3 | 1.0 | 5 |
| Holtenau – Laboe | 19.02. | 19.02. | 1 | — | 5 |
| Kamminke, harbour and vicinity | 17.02. | 24.02. | 8 | — | 5 |
| Karnin, Firth of Szczecin | 14.02. | 20.02. | 7 | — | 5 |
| Karnin, Peenestrom | 16.02. | 20.02. | 5 | — | 5 |
| Kiel, inner harbour | 17.02. | 20.02. | 4 | — | 5 |
| Neuendorf, harbour and vicinity | 17.02. | 22.02. | 6 | — | 5 |
| Neustadt, harbour | 19.02. | 19.02. | 1 | 1.0 | 5 |
| Rostock – Warnemünde | 17.02. | 22.02. | 6 | — | 5 |
| Rostock, city harbour | 13.02. | 23.02. | 8 | — | 10 |
| Schlei, Kappeln – Schleimünde | 17.02. | 20.02. | 4 | 1.0 | 5 |
| Schlei, Schleswig – Kappeln | 13.01. | 22.02. | 9 | 5.0 | 5 |
| Thiessow, bodden area | 17.02. | 20.02. | 4 | — | 5 |
| Thiessow, sea | 17.02. | 17.02. | 1 | — | 5 |
| Ueckermünde, Firth of Szczecin | 17.02. | 20.02. | 4 | — | 5 |
| Ueckermünde, harb. – river mouth | 17.02. | 21.02. | 5 | — | 5 |
| Ueckermünde, harbour | 17.02. | 21.02. | 5 | — | 5 |
| Warthe, Peenestrom | 17.02. | 24.02. | 8 | 2.0 | 5 |
| Wismar – Walfisch | 13.01. | 21.02. | 7 | 2.0 | 5 |
| Wismar, harbour | 03.02. | 22.02. | 9 | 4.0 | 5 |
| Wolgast – Peenemünde | 19.02. | 22.02. | 4 | — | 10 |
| Zingst, Zingster Strom | 19.02. | 19.02. | 1 | 1.0 | 5 |
| Begin | End | Days with ice | max.
ice thickness [cm] (Measurement) |
max.
ice thickness [cm]* (Baltic Sea ice code) |
|
|---|---|---|---|---|---|
| Amrum, Schmaltief | 18.02. | 21.02. | 4 | — | 5 |
| Amrum, Vortrapptief | 18.02. | 21.02. | 4 | — | 5 |
| Amrum, Wittdün harbour | 18.02. | 21.02. | 4 | — | 10 |
| Dagebüll, fairway | 18.02. | 18.02. | 1 | — | 5 |
| Dagebüll, harbour | 18.02. | 18.02. | 1 | — | 5 |
| Ellenbogen (Sylt), Listertief | 15.02. | 15.02. | 1 | 5.0 | 5 |
| Sylt, Harbour List | 17.02. | 18.02. | 2 | — | 5 |
| Tönning, harbour | 18.02. | 20.02. | 3 | 5.0 | 5 |
B. Baltic Sea ice codes of German stations.