The ice winter 2020/2021 at the German coasts and the Baltic Sea
Table of Content
- 1 Overview of the ice winter 2020/21
- 2 The ice winter at the German North Sea and Baltic Sea coasts
- 2.1 Weather conditions at the German coastal areas
- 2.2 Ice conditions at the German North Sea and Baltic Sea coasts
- 2.3 Navigational conditions at the German North Sea and Baltic Sea coasts
- 2.4 Ice winter severity
- 3 Ice conditions in the western and southern Baltic Sea, Kattegat and Skagerrak
- 4 Ice conditions in the northern Baltic Sea
- 5 The ice winter 2020/21 in long-term comparison
- 6 Reporting of the BSH
- 7 Bibliography
- Appendix
1 Overview of the ice winter 2020/21
The ice season 2020/21 at the German North Sea and Baltic Sea coast was a weak ice winter, that was dominated be an approximately two week long frost period in ther first half of February. During this period, severe to very severe frost caused ice formation along the entire German coast. Unusually warm weather in the second half of February lead to a relatively rapid melting of the sea ice. The ice season of the entire Baltic Sea was also a weak ice winter. Ice formation started late in the season and the first significant ice outside the archipelagoes of the Bay of Bothnia formed in the second half of December. At the time of the maximum ice extent the Bay of Bothnia, the Quark, coastal areas of the Sea of Bothnia, large parts of the Gulf of Finland and the Gulf of Riga, coastal areas of Germany, southern Sweden, Danmark and Norwegian fjords in the Skagerrak were covered by ice. The last ice in the Bay of Bothnia melted at the end of May.2 The ice winter at the German North Sea and Baltic Sea coast
2.1 Weather conditions at the German coastal areas
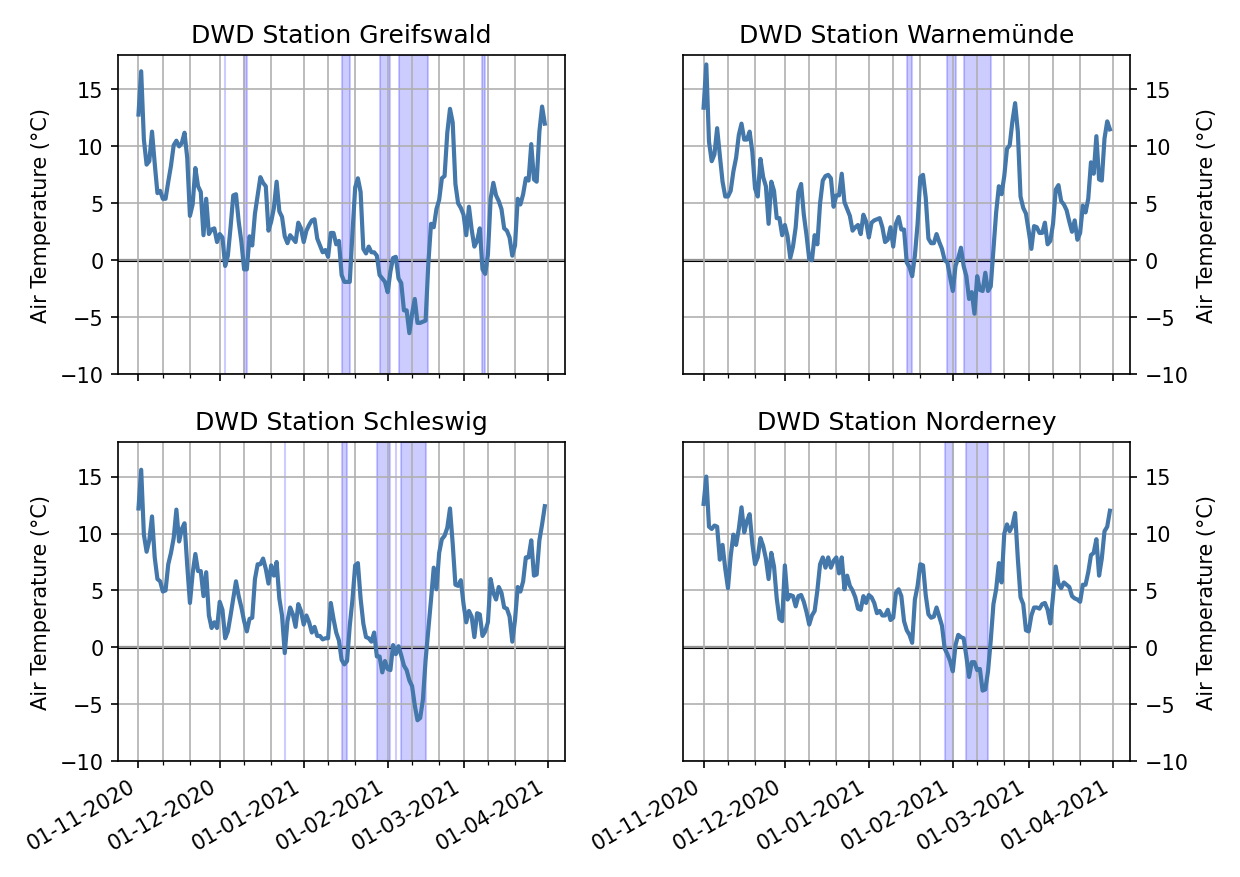
The winter 2020/21 was dominated by a cold period in the first half of February that caused up to very severe frost at some places. Daily mean temperatures of some selected weather stations along the German coast are shown in Figure 1. Warmer and colder periods alternate in December and January but daily mean temperatures stay mostly above 0 °C. Mid of January, a short period of sub-zero daily mean temperatures occured at some stations along the German Baltic Sea coast. At the end of January a significant drop in air temperatures occured when cold polar air masses were brought to northern Germany. In the first half of February, daily mean air temperatures were partly clearly below the freezing point. The weather changed quickly mid February when warm air masses from the southwest significantly increased the daily mean air temperatures to locally more than 10 °C. The daily maximum temperatures were often the highest in a February at all times since the start of the records. Temperatures at the beginning of March were slightly colder but no significant frost occured again.
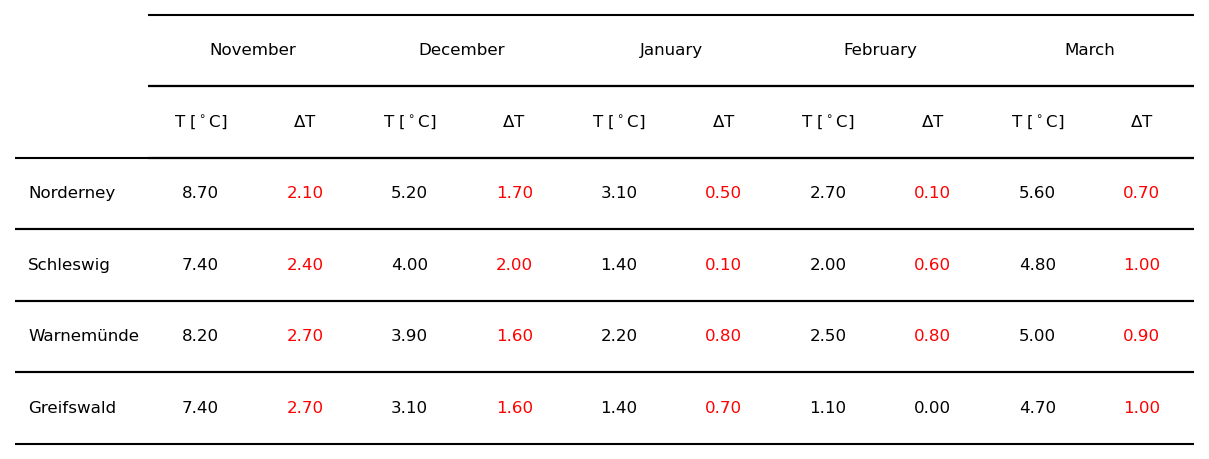
Despite the relative cold first half of February, monthly mean temperatures of the selected weather stations were above the long term mean value of the reference period from 1981-2010 for all winter months (sea Table 1). November and December were 1.6 to 2.7 °C warmer than the reference period while January, February and March were only up to 1 °C warmer. The winter 2020/21 was the tenth too warm winter in a row [1].
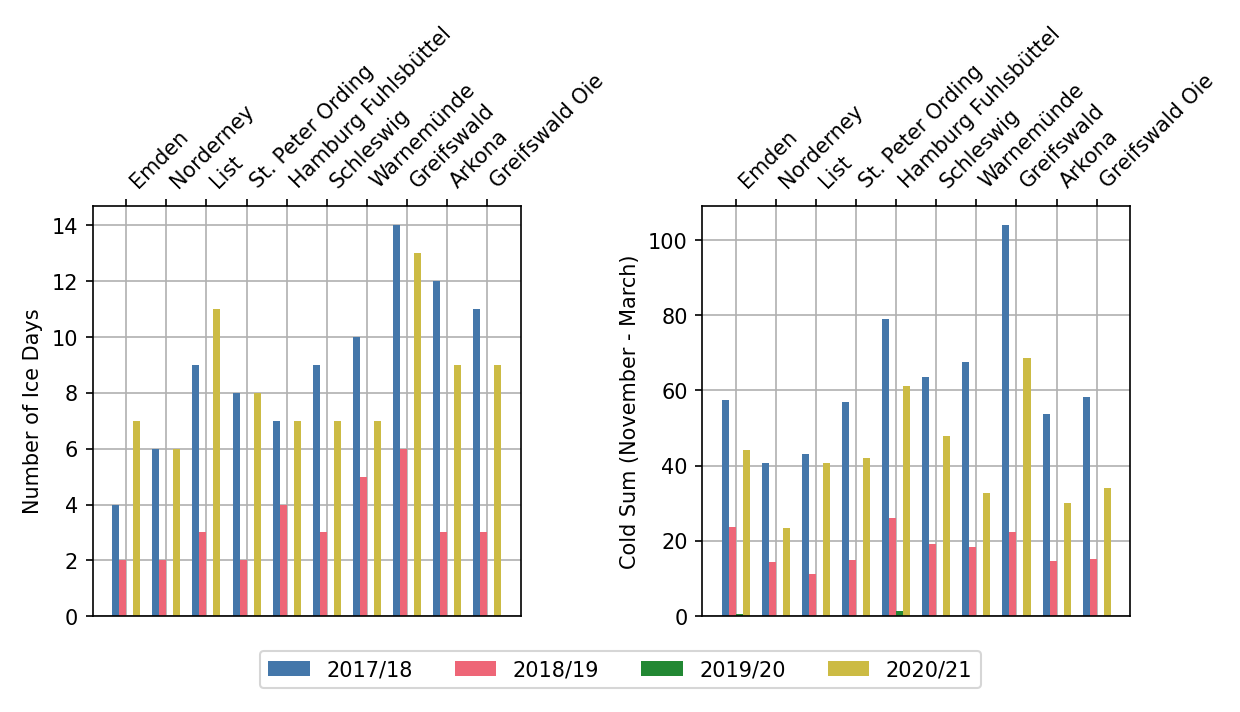
Compared to the last two winters, this winter was much colder. This is demonstrated in Figure 2 by the number of ice days, the days with a daily maximum temperature below the freezing point, and the cold sum, the sum of negative daily mean temperatures between November and March. The winter 2017/18 however was slightly colder than this winter; only at the North sea, there were some more ice days this winter. The past winters along the coast can all be classified as mild winters (cold sum < 100), only for Greifswald a cold sum slightly above 100 was obtained in the winter 2017/18.
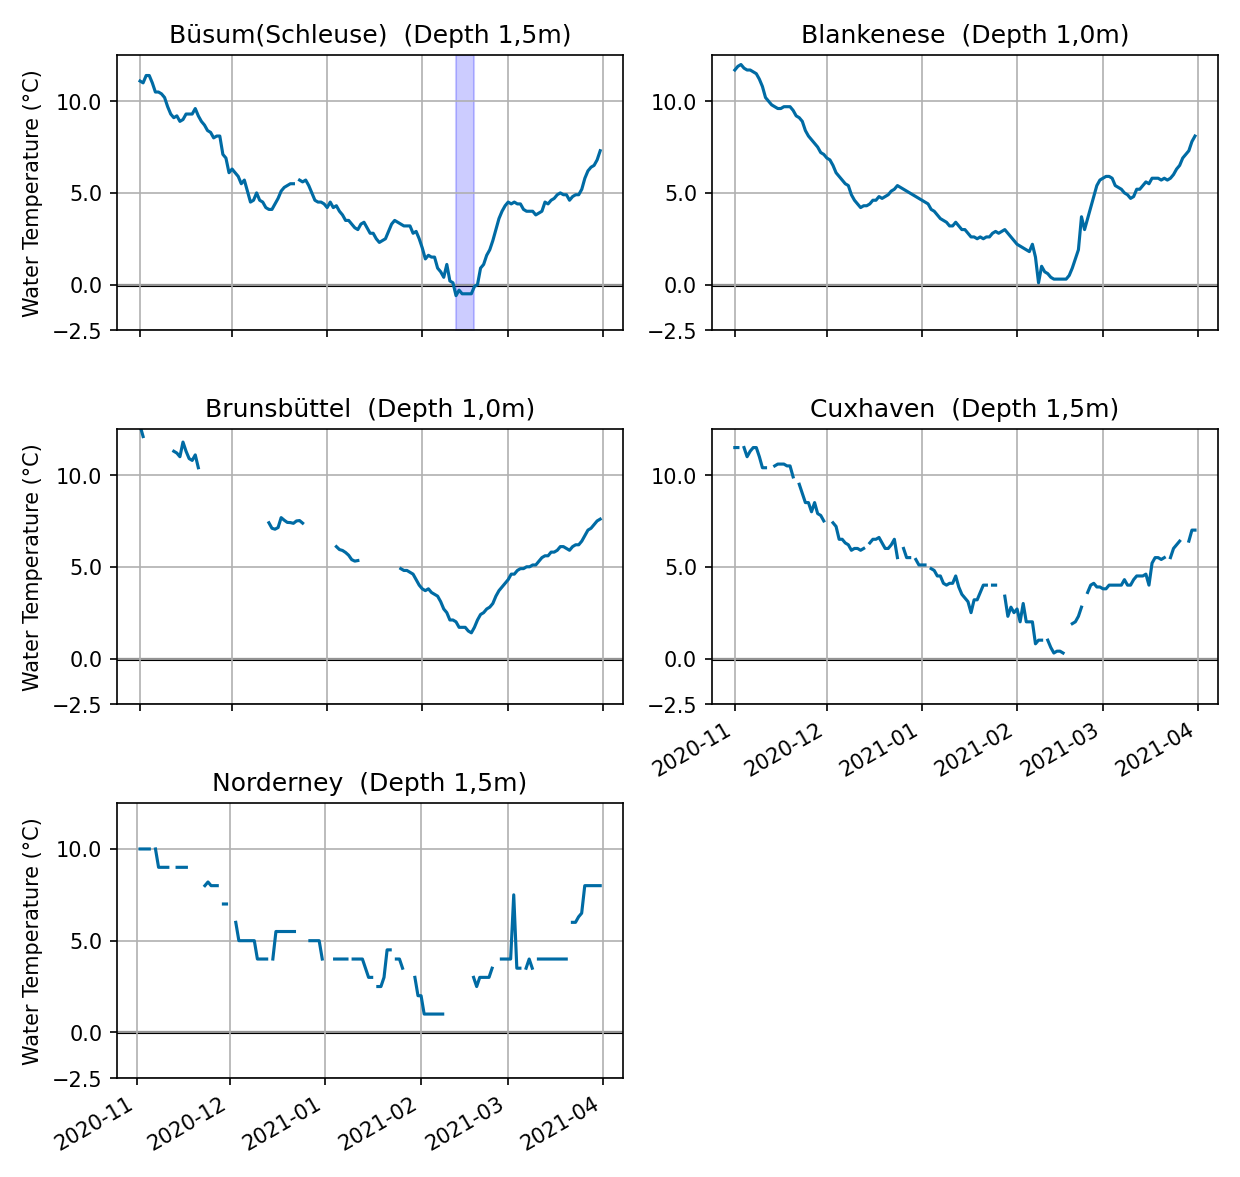
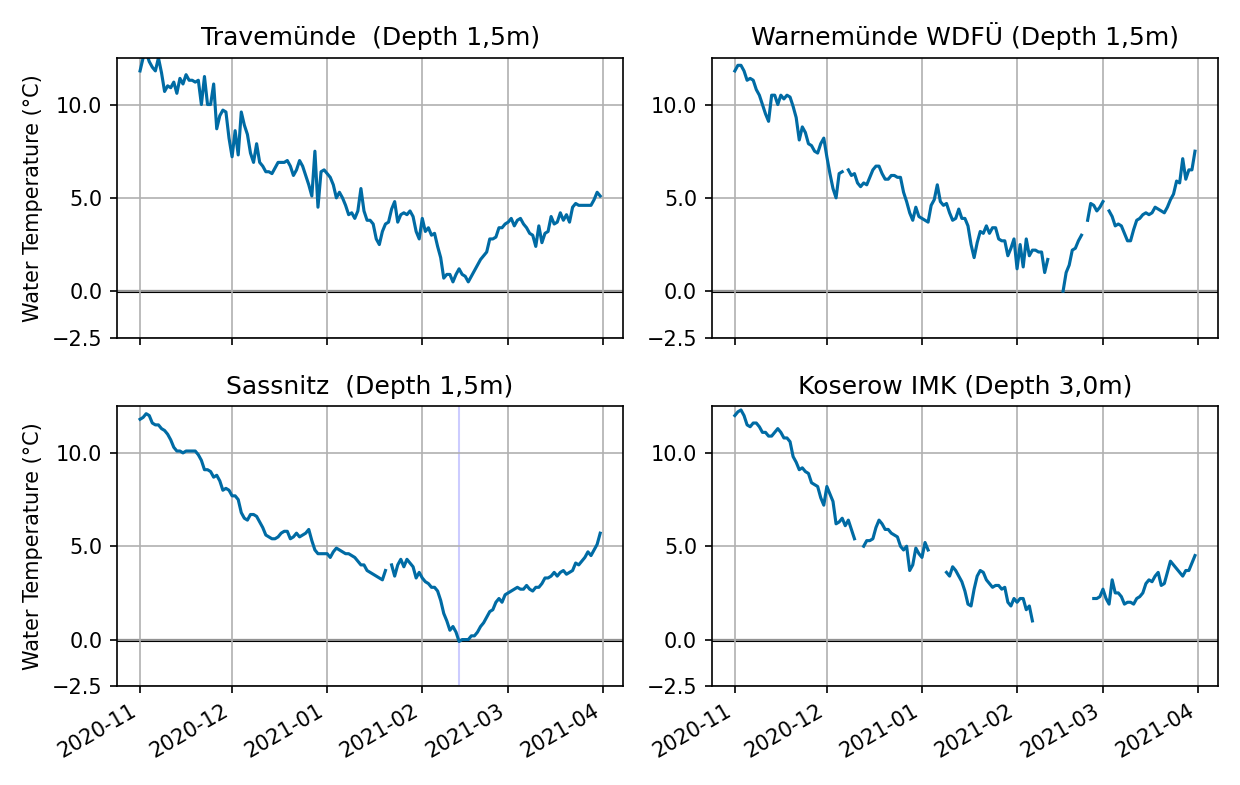
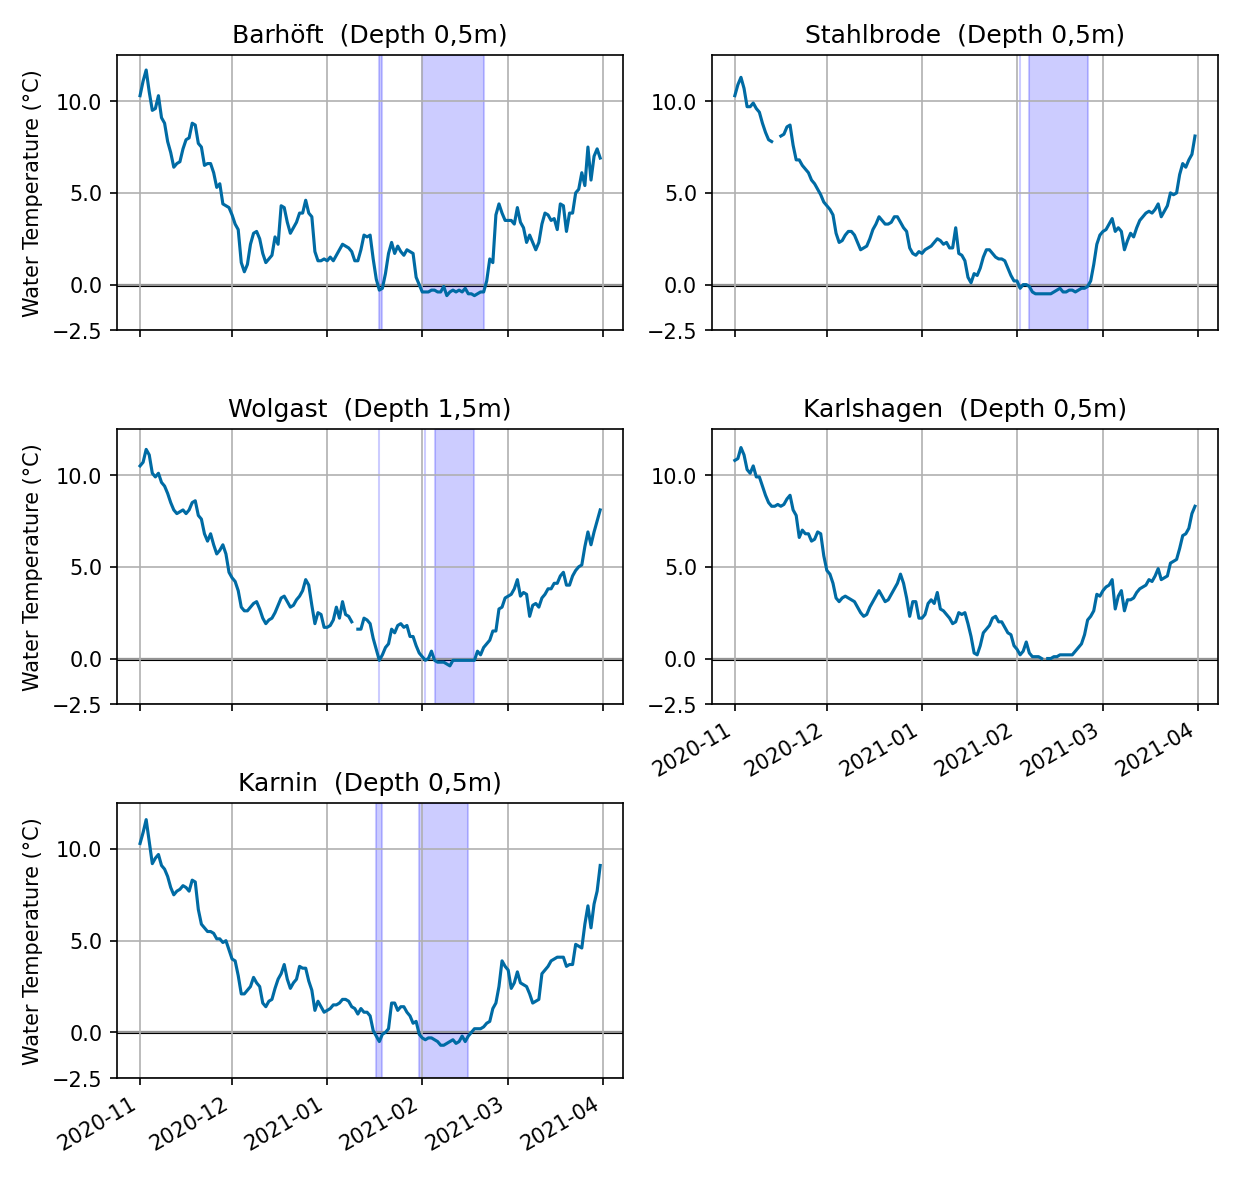
The water temperatures along the German coast reflect the course of the air temperatures and the lowest temperatures are reached in the first three weeks of February. At the North Sea coast (see Figure 3) the temperatures drop continuously during the winter and reach their minimum values mid February. However, only at the measuring station in Büsum sub freezing temperatures are recorded. Along the outer coasts of the Baltic Sea, water temperatures also drop contiunously in the course of the winter and reach their minimun temperatures in mid February. Only the station in Sassnitz recorded temperatures below 0 °C for a short period. Water temperatures at the Bodden waters of the Darß and around Rügen and in the Szczecin Lagoon show the largest drop in November while the temperatures in December and January remain between 0 bis 5 °C (see Figure 5). Mid January the first temperatures below 0 °C are registered at some stations. Beginning of February most stations but Karlshagen show temperatures below the freezing point. With the warmer temperatures after mid February, water temperatures increase in all sea areas. During the beginning of march, temperatures remain quite static before they increase further.
2.2 Ice conditions at the German North Sea and Baltic Sea coasts
The ice winter 2020/21 along the German North Sea and Baltic Sea coasts followed mostly the weather pattern. A first period of sea ice formation was observed mid January in sheltered areas of the Baltic Sea. The cold temperatures in the first half of February caused ice formation along the entire North and Baltic Sea coasts.
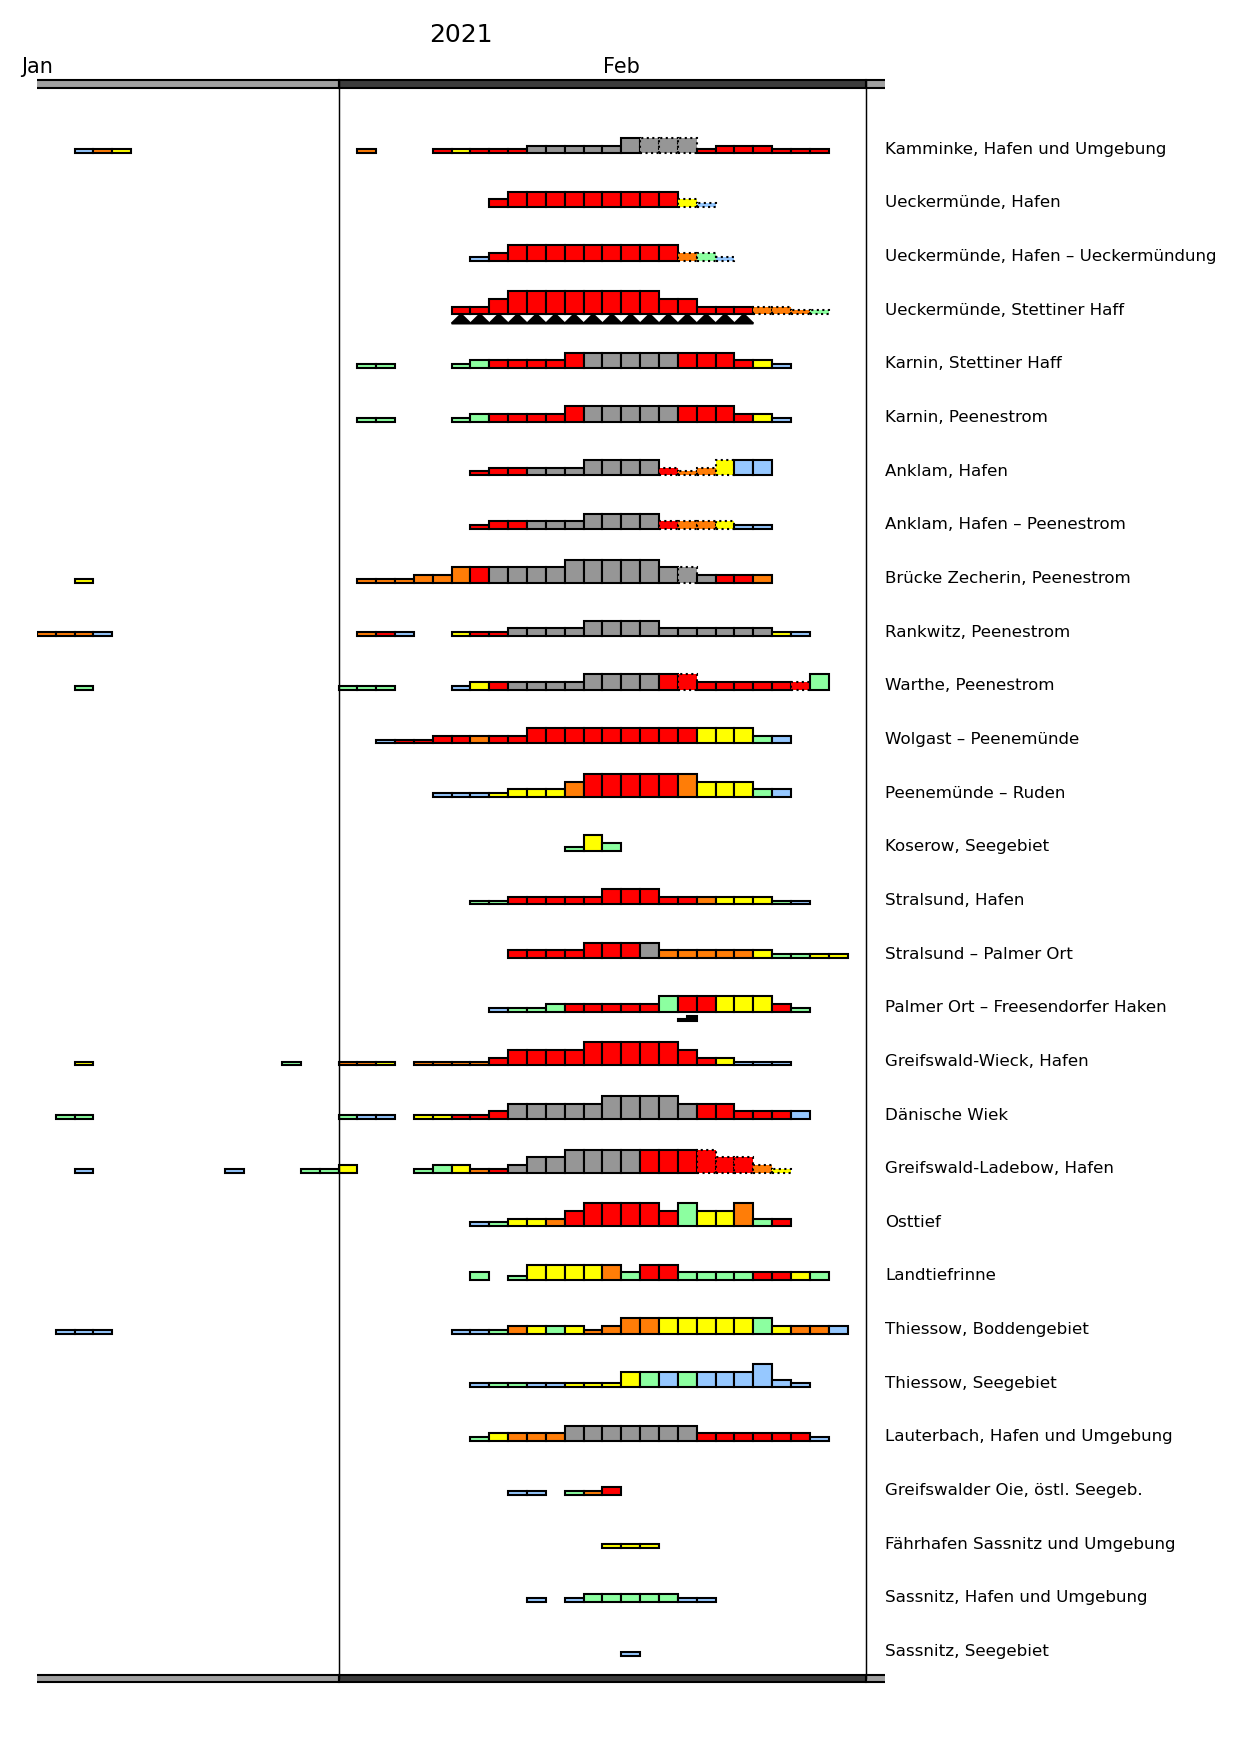
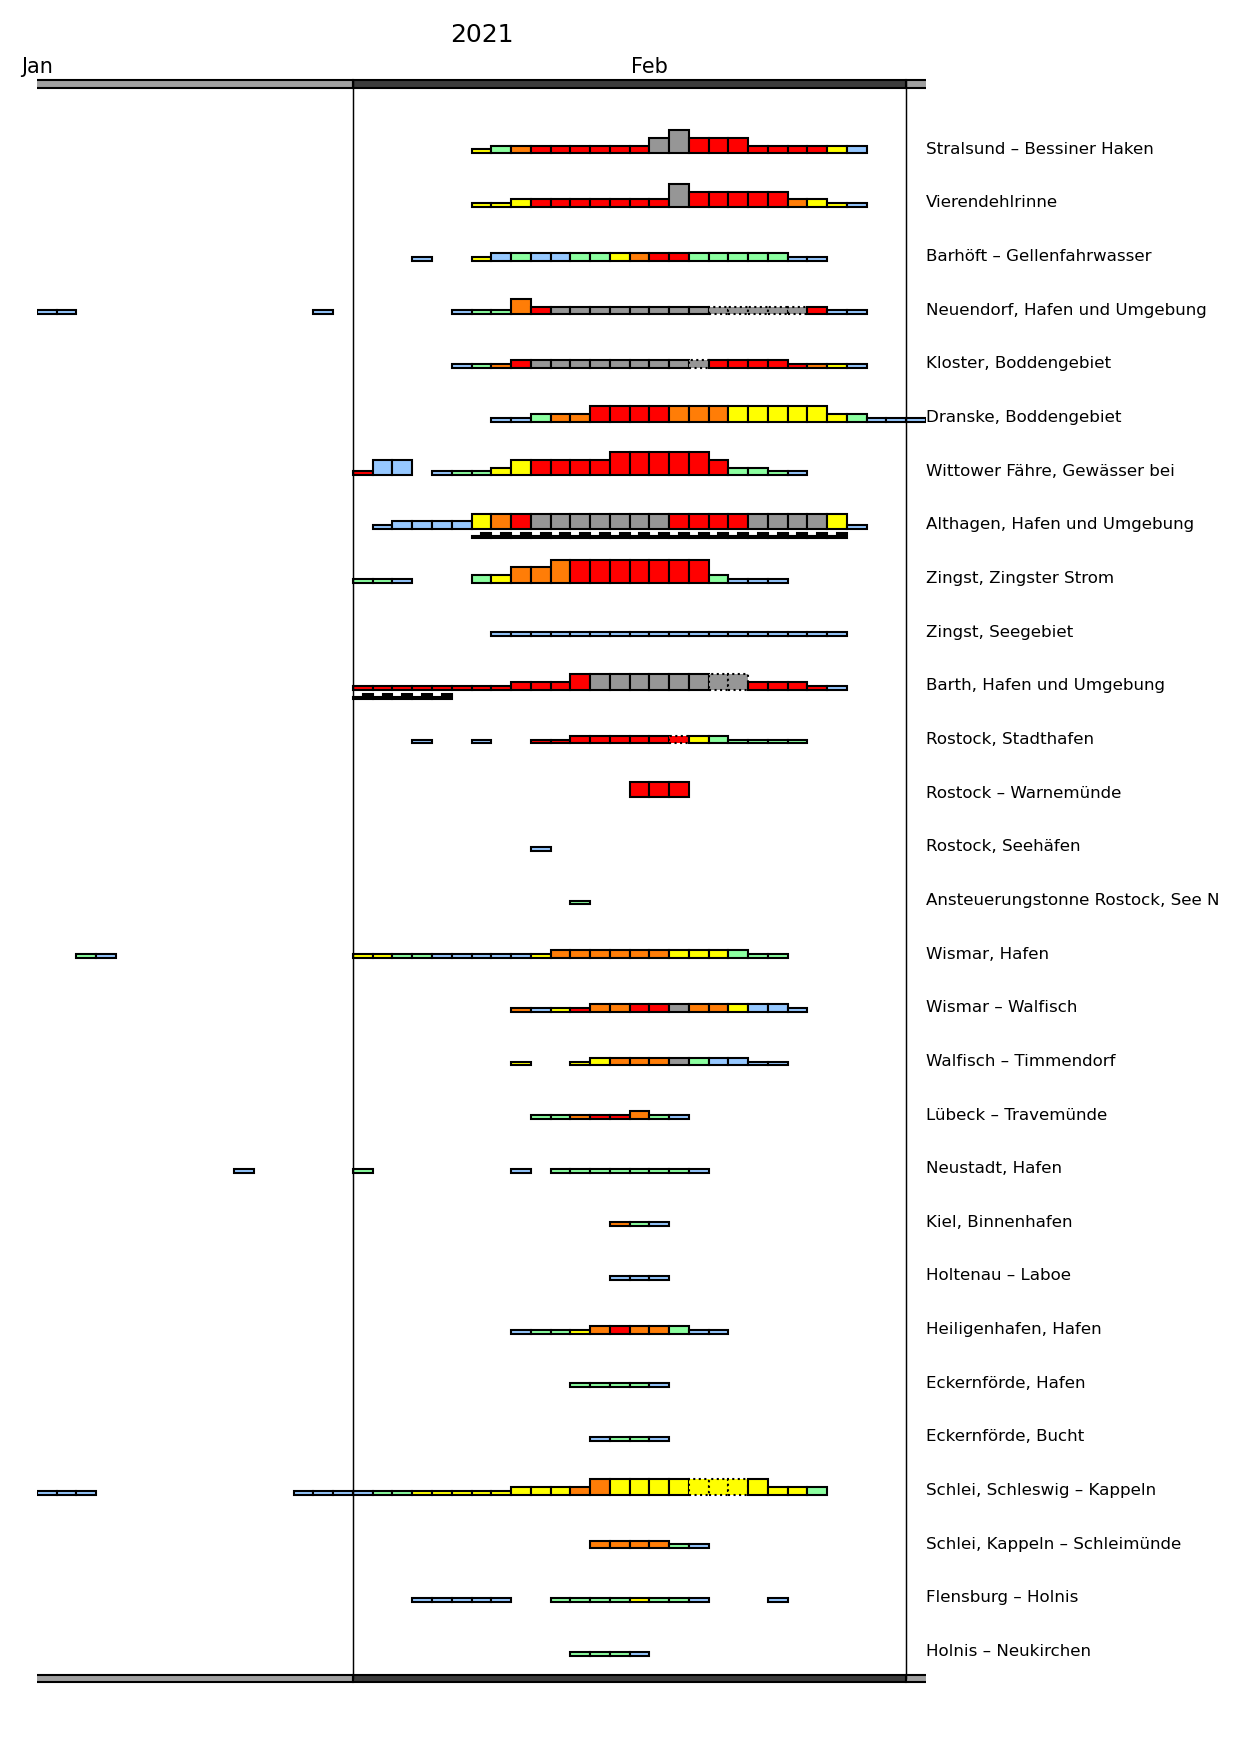
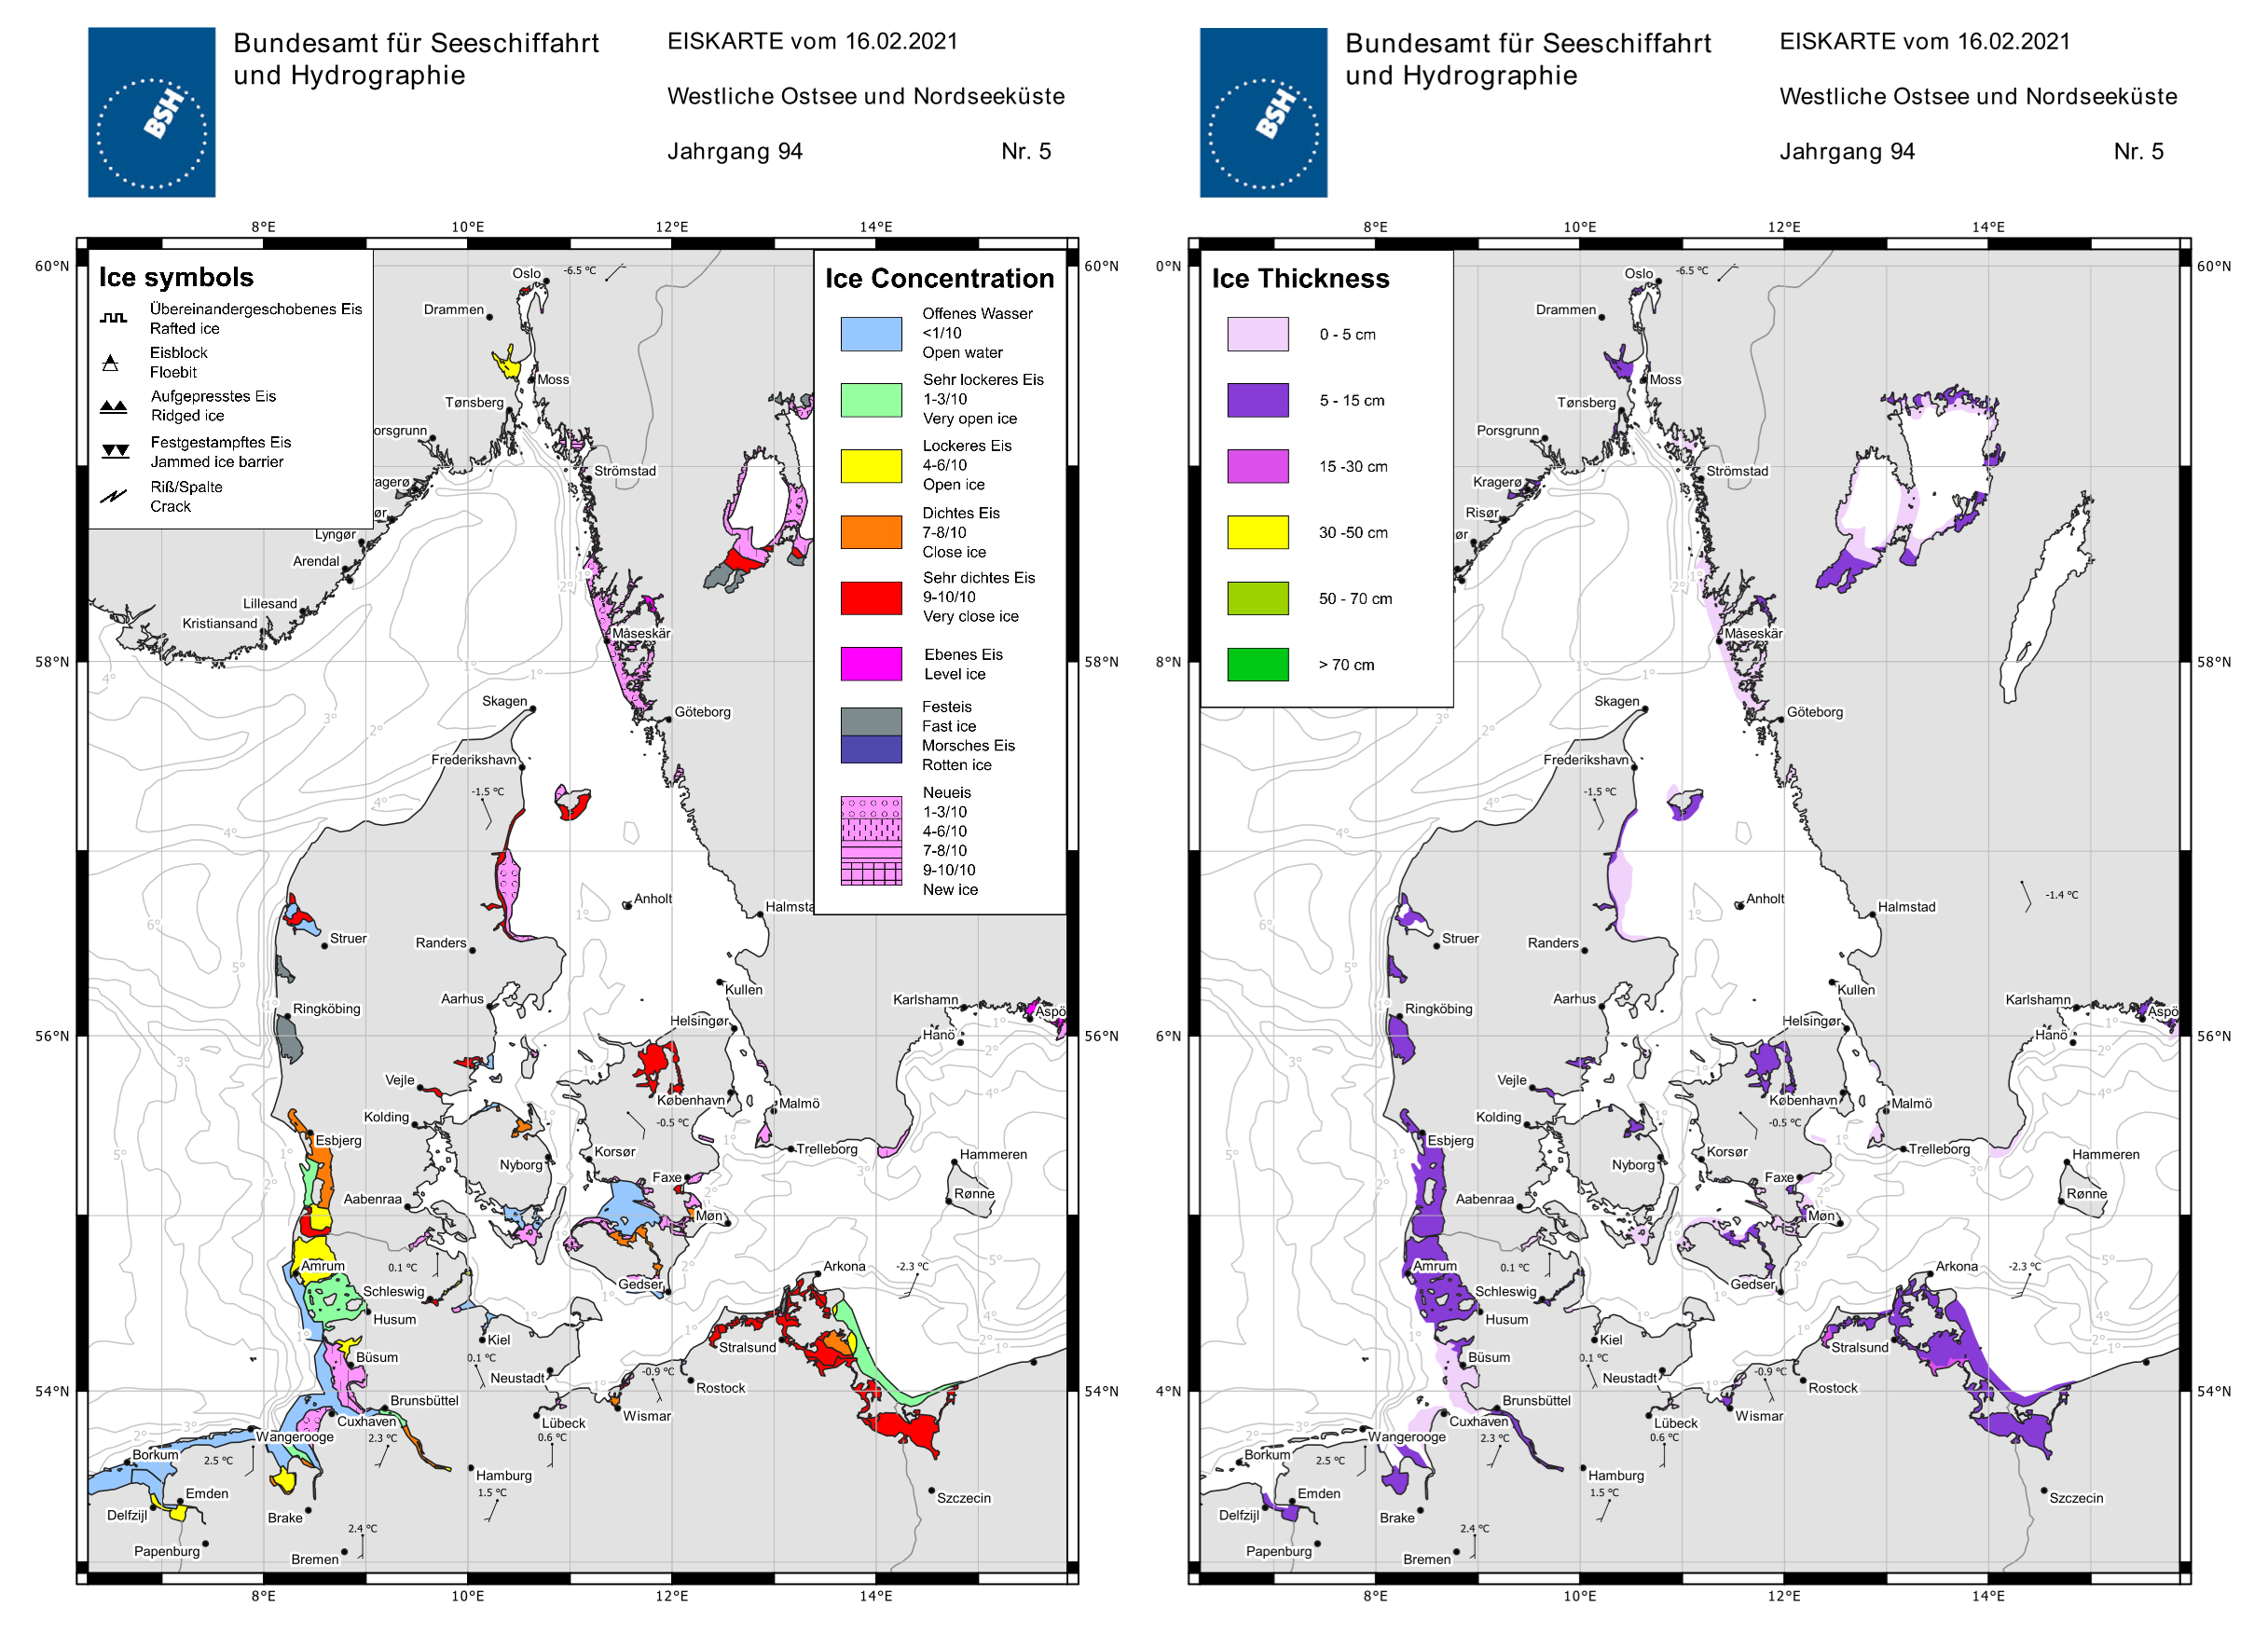
The first ice along the German Baltic Sea coast formed during the first short frost period in mid January. Ice formation was first reported on 16.01.2021 by the ice observation stations in Schleswig at the Schlei, Neuendorf/Hiddensee and Rankwitz/Peene. In the following days ice formed in coastal areas in the Bay of Greifswald, along the river Peene and in the Szczecin Lagoon. This first short period of ice ended around the 20.01.2021 when warmer air masses were brought in by a low pressure system moving from Great Britain towards Norway. With falling temperatures, ice formation resumed in the end of January/beginning of February and increased noticeable from the 10.02.2021 onwards. The maximum ice extent was observed on the 16.02.2021. The ice situation at this point is shown in Figure 5.
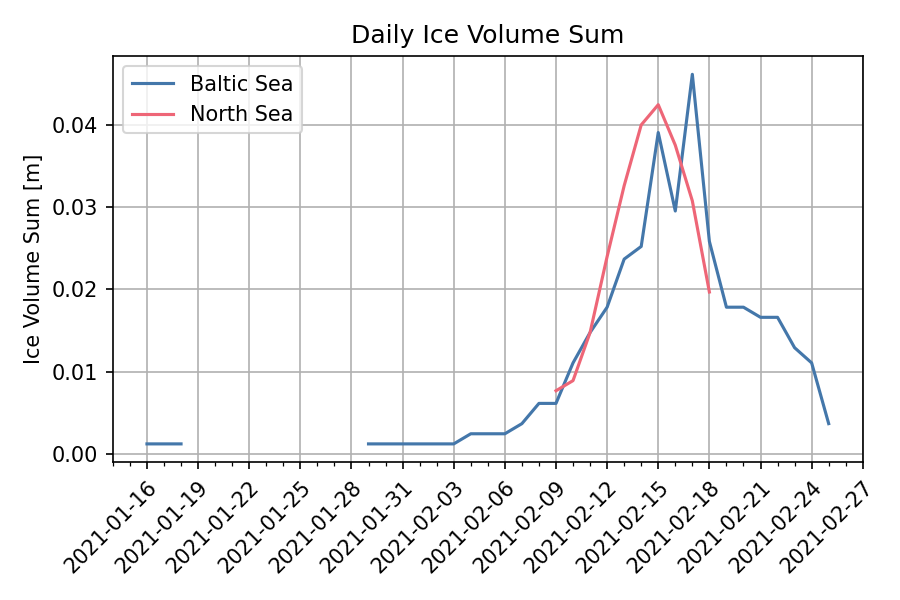
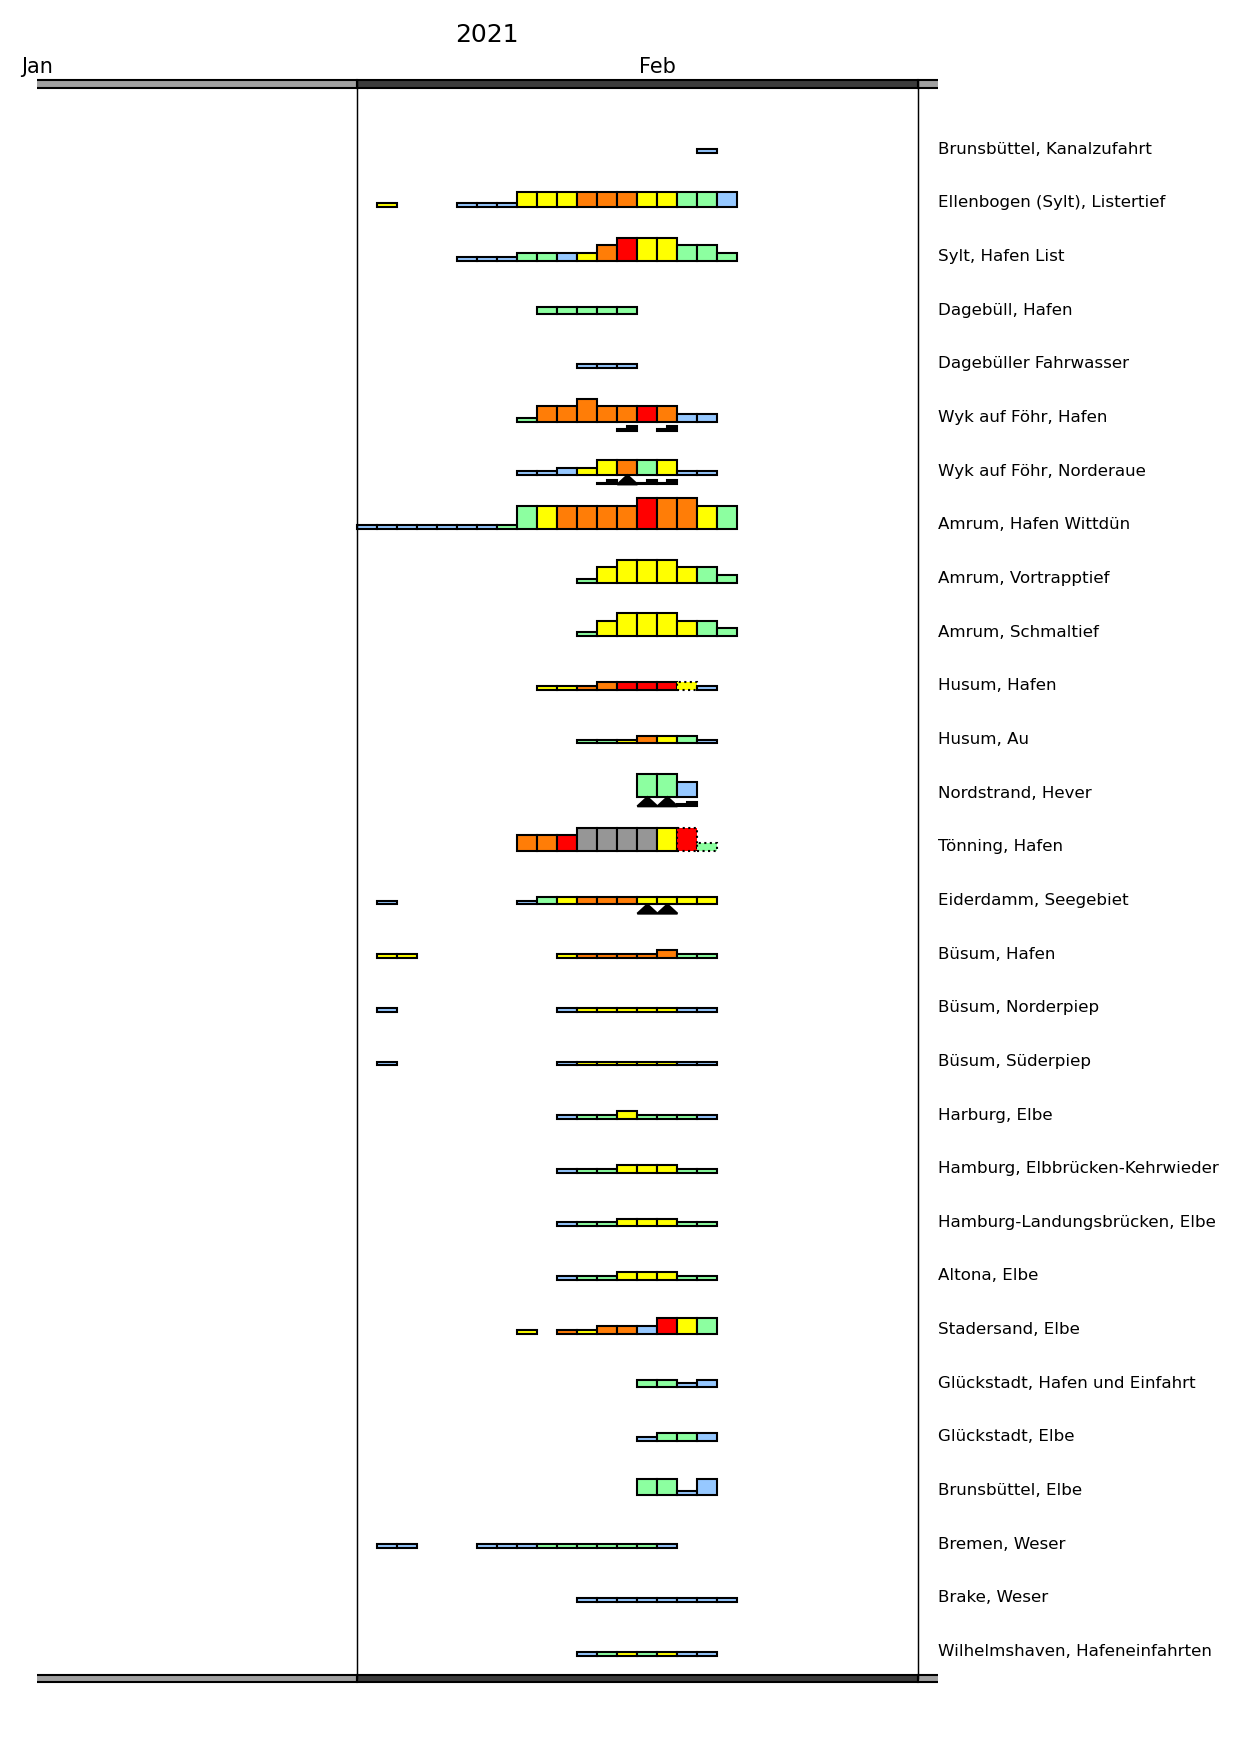
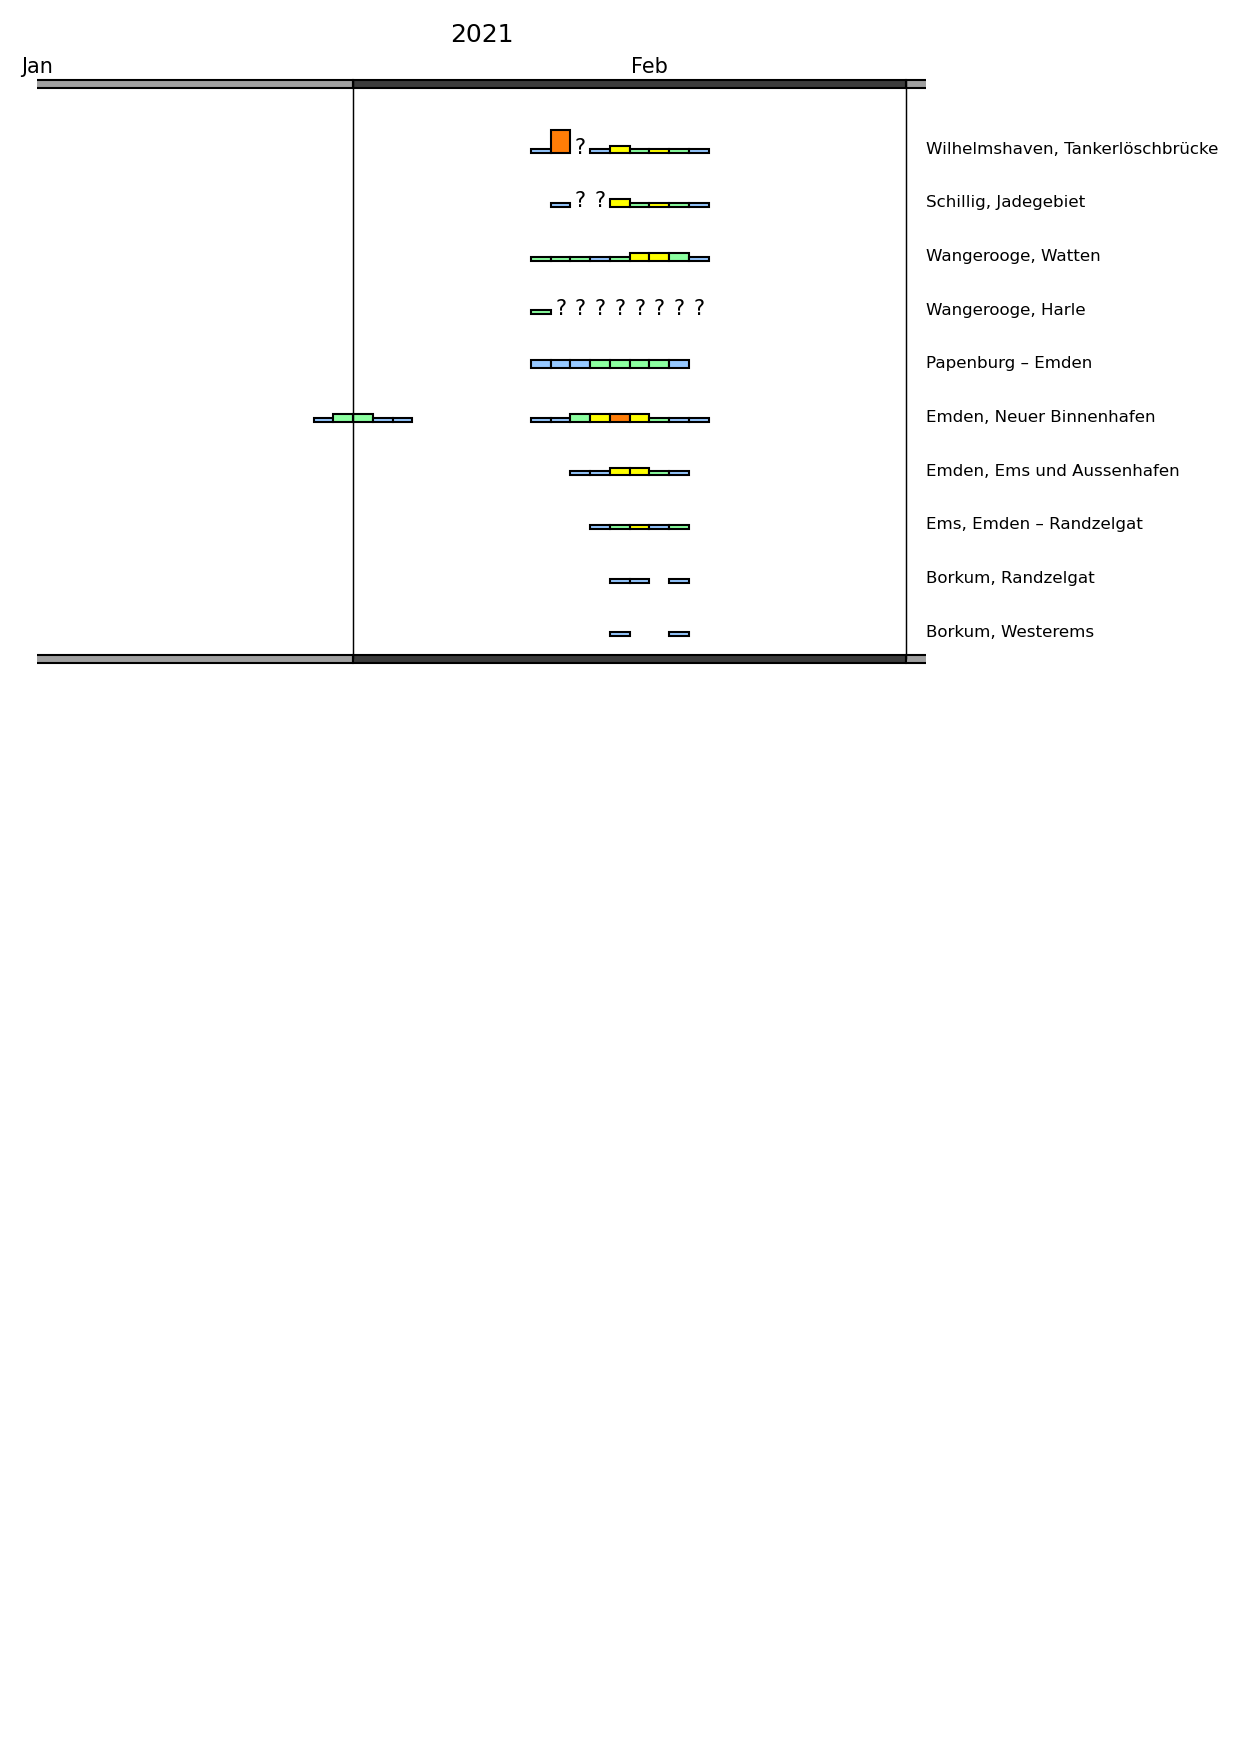
The first ice at the North Sea coast was reported by the ice observing station at Emden Binnenhafen on the 30th January 2021. In sheltered areas, ice formed in the following days. Noticeable ice formation at the North and East Frisian Wadden Seas and the river Elbe took place after February 10th. In the Wadden Seas there was mostly very open to open drift ice with close ice at some places. Ice thicknesses were mostly about 5-15 cm. In some harbours and locally at sea, ice thicknesses up to about 40 cm were reported which mostly were caused by ice floes freezing together due to constant tidal motions of the water. The ice melted quickly with the warmer temperatures from mid February onwards. The last ice was reported on February 19th. The course of the ice winter is also shown in the daily areal ice volume sum of 13 ice climatological stations along the North Sea coast (Borkum/Westerems, Emden (Emsgebiet und Außenhafen), Norderney/Seegatt, Wangerooge/Watten, Hohe Weg/Leuchtturm, Brake (Weser), Helgoland, Stadersand/Elbegebiet, Brunsbüttel, Hamburg/Landungsbrücken, Husum (Au und Hafen), Amrum/Schmaltief, Tönnig (Hafen)) in Figure 7. Ice formation quickly increased from February 10th onwards. With warmer temperatures and the effect of the tides, the ice vanished quickly at the climatological stations.
All in all, 97 of 123 ice observation stations along the North Sea and Baltic Sea coasts reported ice for at least one day. At the Baltic Sea, the maximum number of reported ice days was 30 at the Schlei. In some places of the Bodden waters, Peenestrom and the Szczecin Lagoon ice was reported on 23-26 days. The maximum number of days with ice at the North Sea coast were reported for Amrum (Hafen Wittdün) with 19 and Lister Tief with 15.
2.3 Navigational conditions at the North Sea and Baltic Sea
At the North Sea coast, there were locally obstructions for shipping due to the ice situation. Ferry and freight traffic between Harlesiel and Wangerooge had to be suspended for some days due to the ice situation in the harbour of Harlesiel. At the German Baltic Coast only daytime navigation was allowed from February 11th in the northern approach to Stralsund (including Bodden waters west), eastern approach to Stralsund (from the sea mark „Landtief B“ to the ports of the Bight of Greifswald and to the harbour Stralsund), fairway „Osttief“ and northern Peenestrom, southern Peenestrom, Achterwasser and the Kleines Haff. From February 15th traffic in the Strelasund, eastern approach to Stralsund (from the sea mark „Landtief B“ to the ports of the Bight of Greifswald and to the harbour Stralsund) and fairway „Osttief“ and northern Peenestrom was restricted to vessels with minimum 1000 kW or vessels suitable for navigation in ice. Both restrictions were lifted on February 26th.
2.4 Ice winter severity
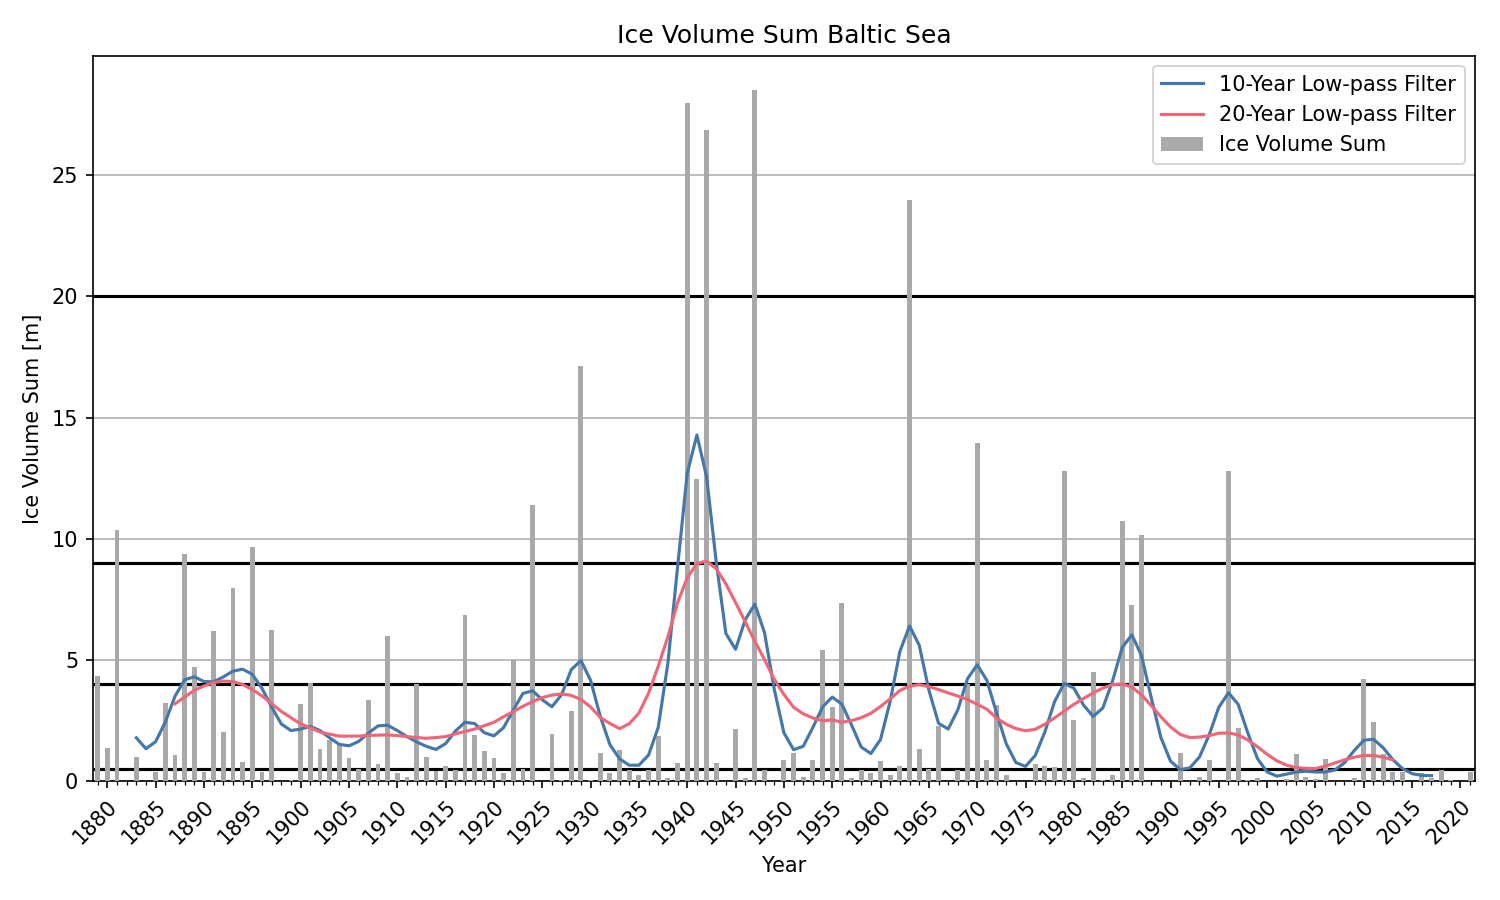
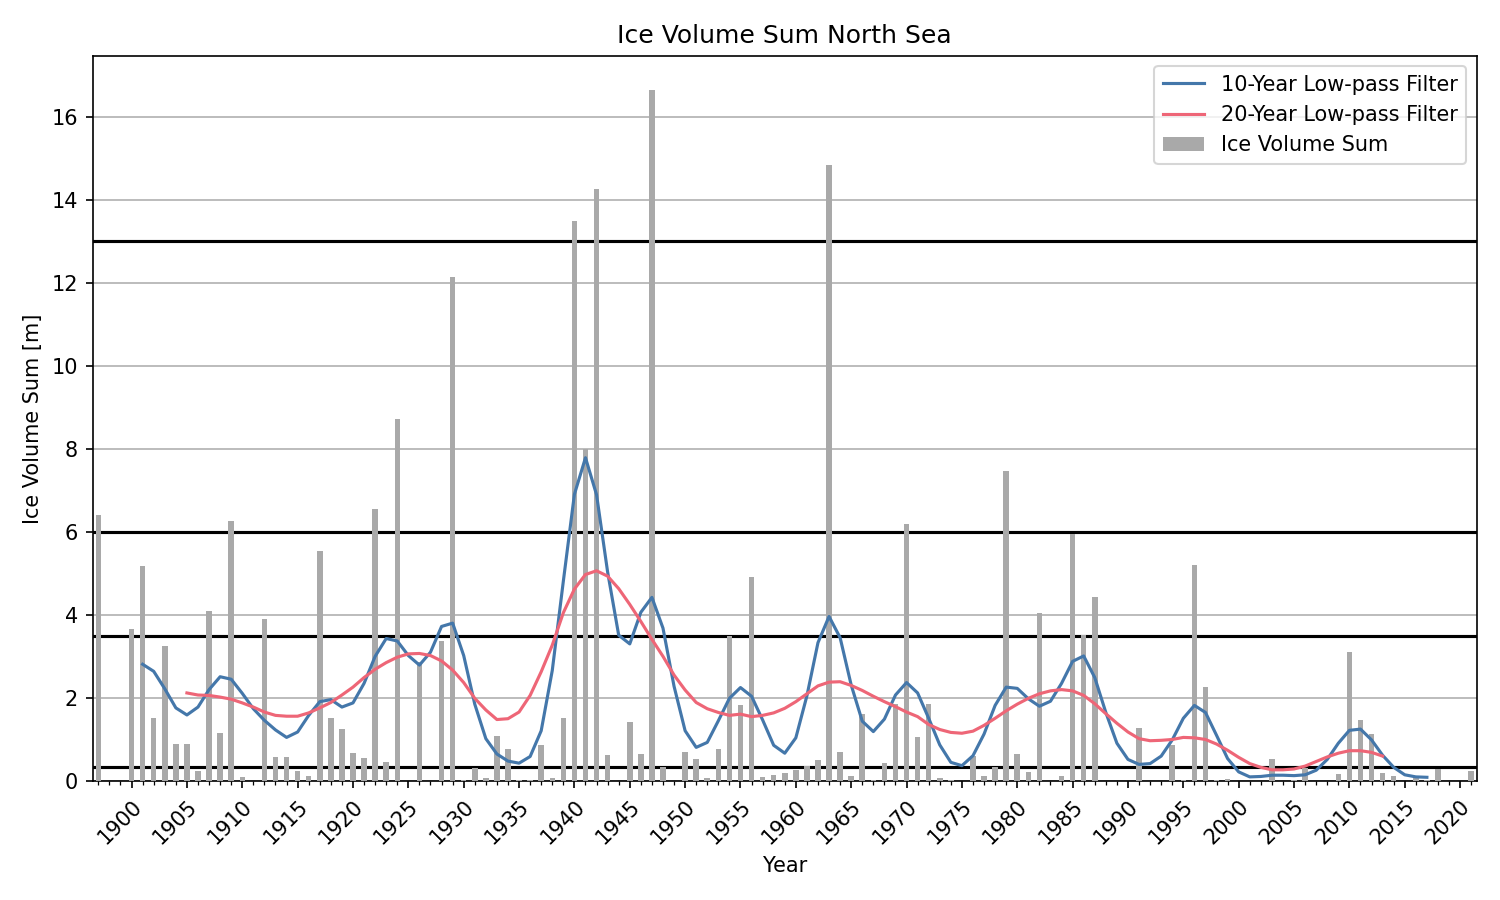
The ice winter severity for the German North Sea and Baltic Sea coast is defined by the areal ice volume sum of 13 ice climatological stations for each coastal area (see 2.2). The accumulated ice volume sum of the winter 2020/21 is shown in Figure 8. At the Baltic Sea coast, an areal ice volume sum of 0.37 m and at the North Sea coast of 0.26 m was calculated. Therefore, the ice winter at both German coastal areas is a weak ice winter. Moderate ice winters start at an areal ice volume sum of 0.5 m at the Baltic Sea and 0.35 m at the North Sea. It is the ninth weak winter in a row at both coasts as shown in a time series of areal ice volume sum in Figure 9 and 10. The black lines show the boundaries for weak, moderate, severe, very severe and extremely severe ice winters.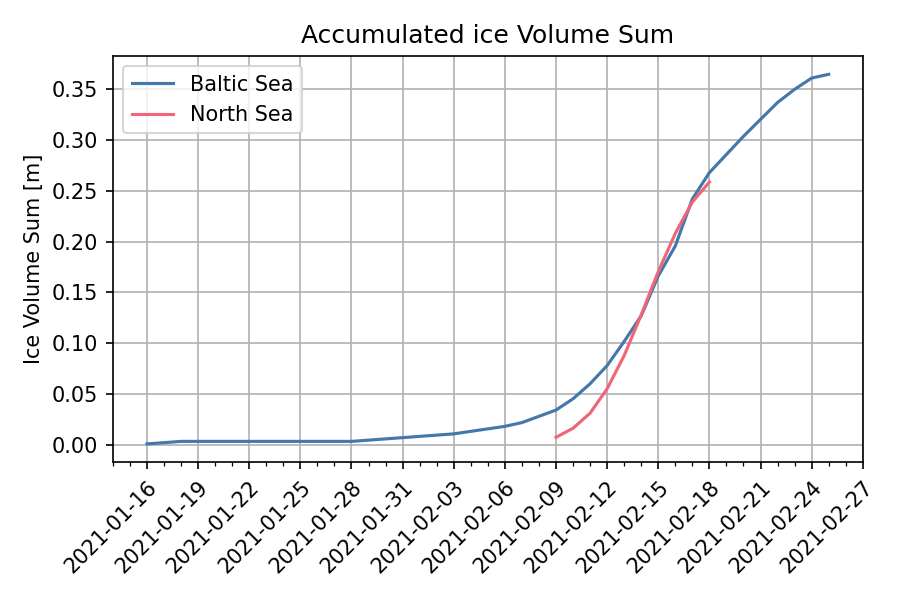
3 Ice conditions in the western and southern Baltic Sea, Kattegat and Skagerrak
Noticeable ice formation startet in fjords and archipelagoes of the Norwegian and Swedish coasts in Skagerrak and Kattegat in the beginning of February. In sheltered areas sea ice thicknesses of up to 15 cm were reached but in some Norwegian fjords the fast ice got up to 30 cm thick. At the end of February the area was mostly ice free. In Danish waters first sea ice formation was observed mid of January in some sheltered places, that quickly melted away. Since the beginning of February increased ice formation took place in fjords and sheltered areas. The maximum ice thickness reached up to 15 cm in some areas. Navigation was not obstructed and most of the ice was gone by the 25th of February. In the southern Baltic Sea, first ice formation started mid of January in the Szczecin Lagoon, Vistula Lagoon and Curonian Lagoon. In the Szczecin Lagoon the ice persisted only for a few days before ice formation started again with the beginning of February. Szczecin Lagoon was covered by fast ice from the 10th of February onwards that reached a maximum ice thickness of about 20 cm. The area was ice free from the beginning of March. In the Bay of Pomerania some partly open drift ice was observed from 15th - 17th of February with a thickness of up to 10 cm. Vistula Lagoon and Curonian Lagoon were continuously covered by ice and most of the ice vanished by mid March. The maximum ice thickness was about 15-25 cm.
4 Ice conditions in the northern Baltic Sea
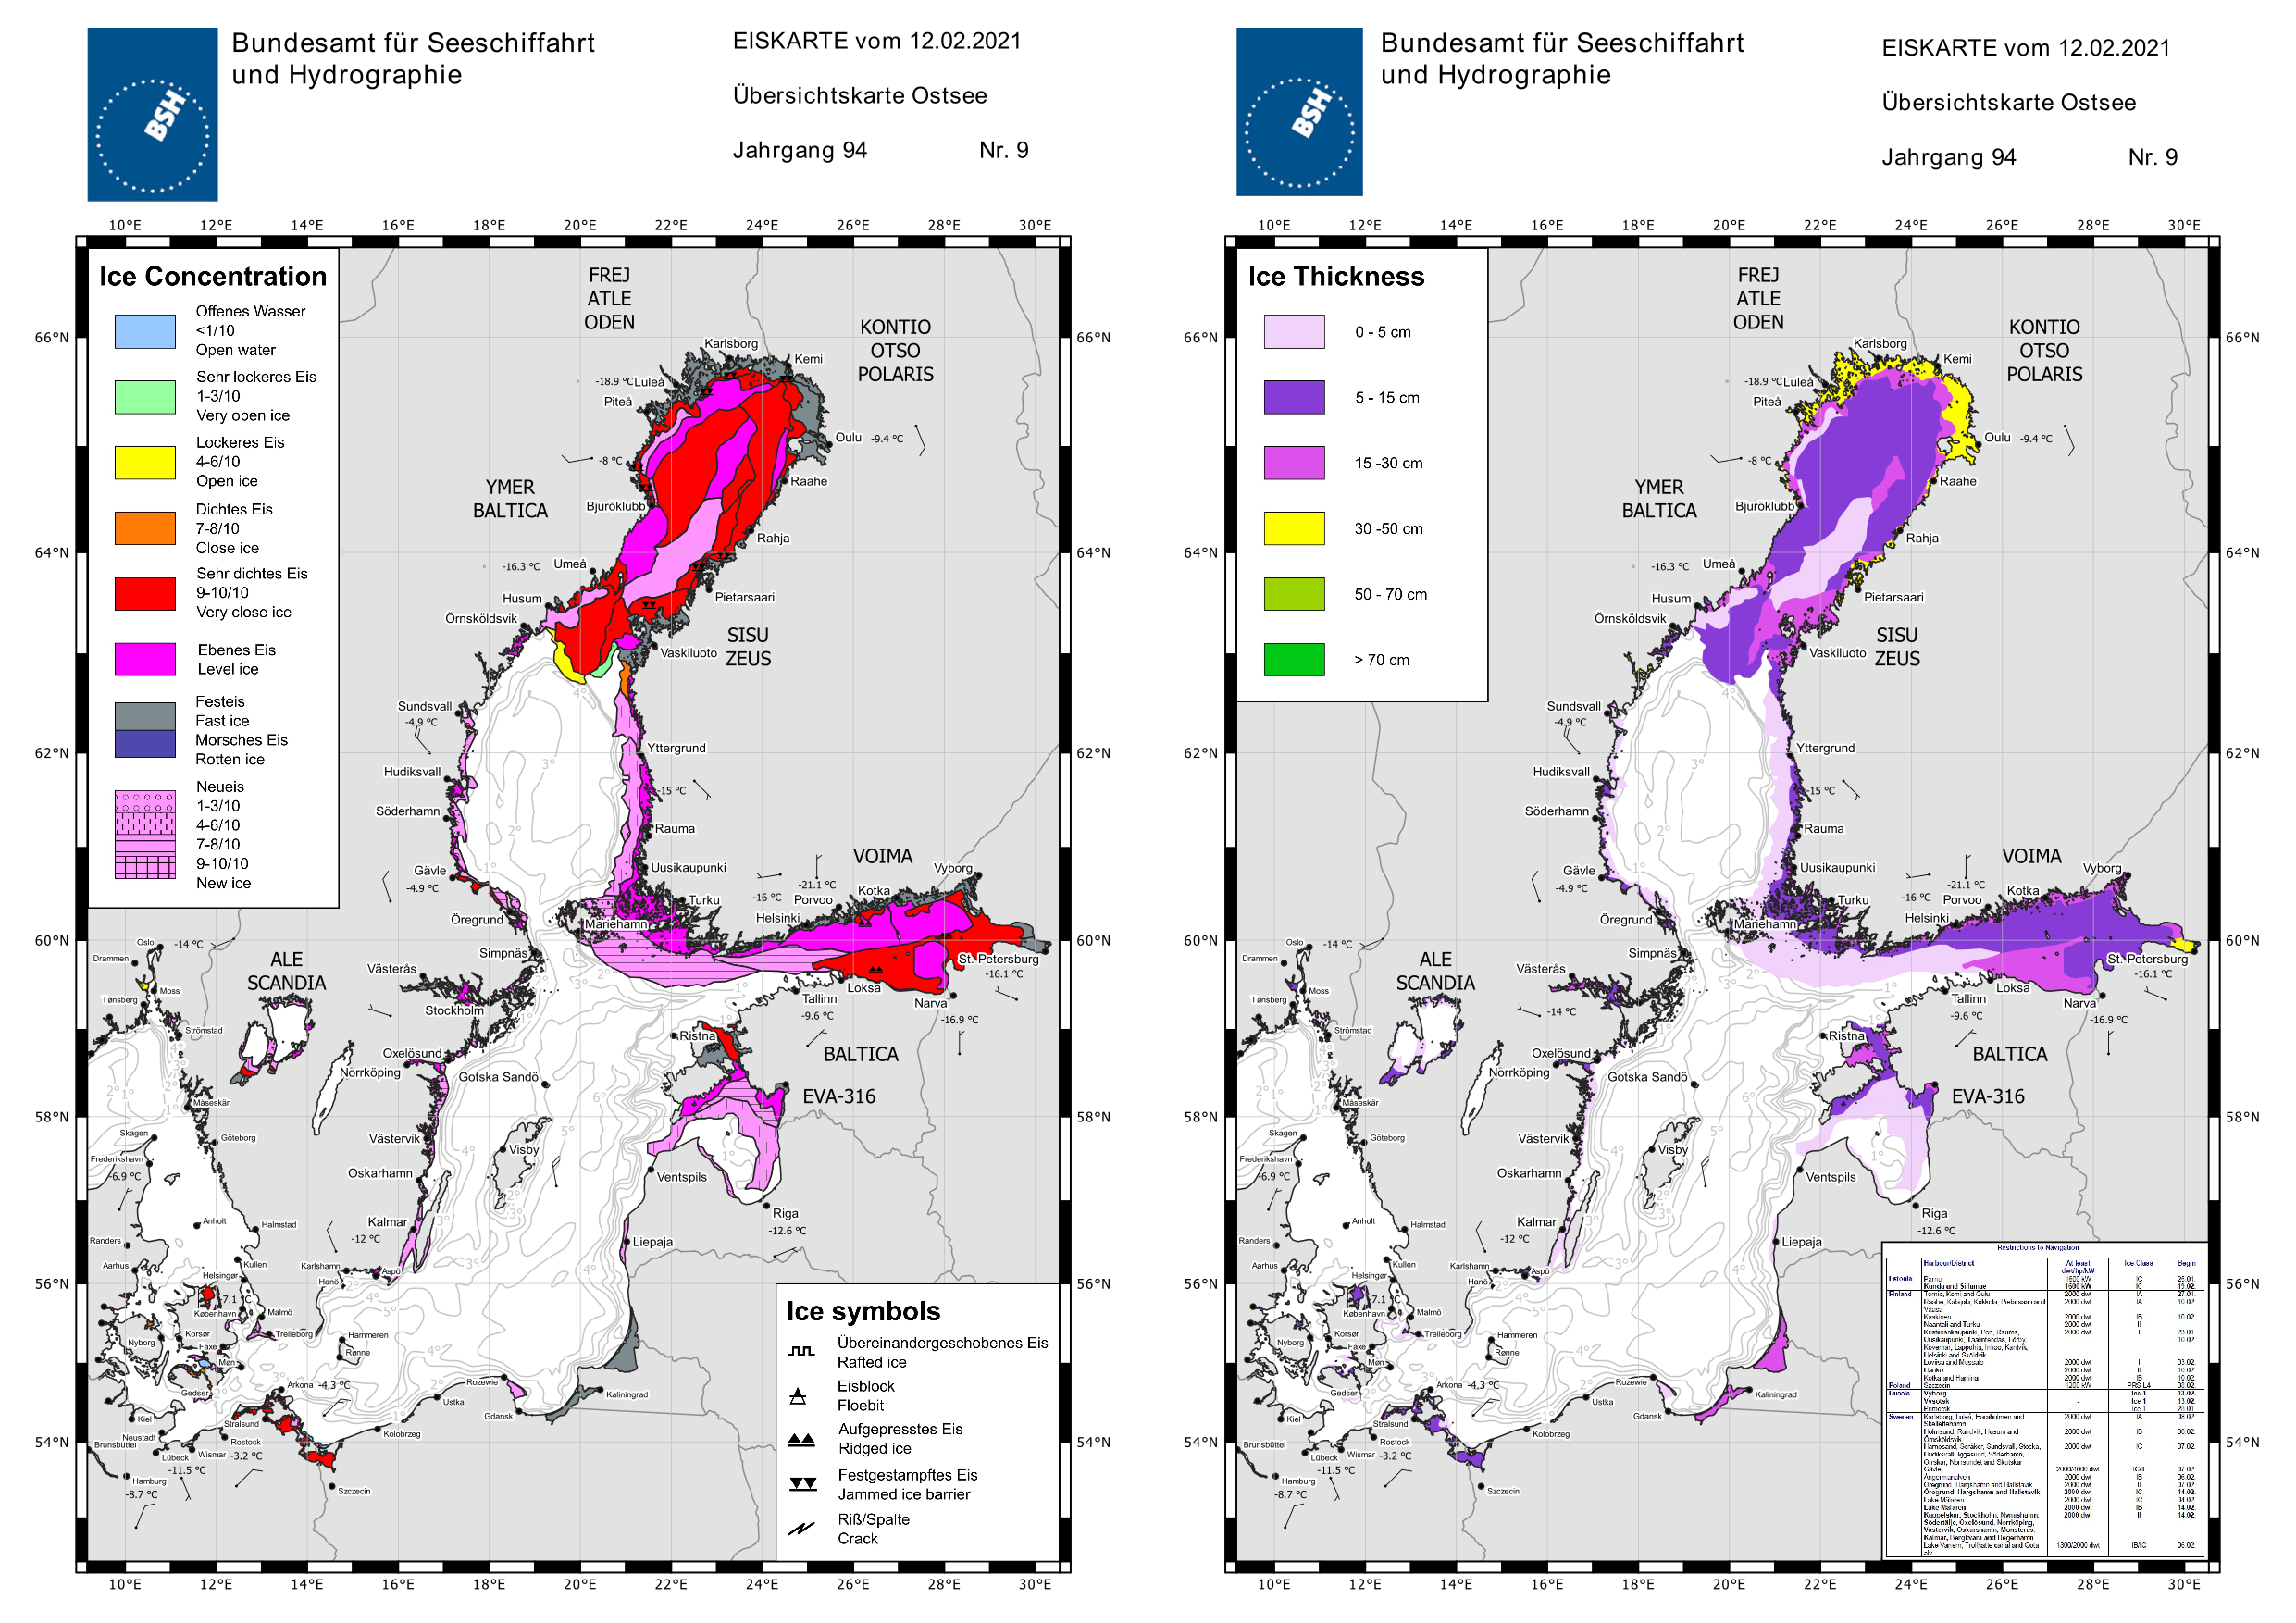
In the Bay of Bothnia, the first ice formed in the inner archipelagoes by the end of November. It took however until the end of December that noticable ice formed outside the sheltered coastal areas. By the end of January the entire area of the Quark was covered with close or new ice, the southwest part of the Bay of Bothnia was, however, still mostly ice free at sea. In the Sea of Bothnia ice started to form in the northern part beginning of January and by mid January new ice had formed along the entire eastern coast and a bit later also along the western coast. Noticeable ice formation in the eastern Gulf of Finland started around the 10th of December. Only slowly the ice edge advaced westwards along the Finnish coast. In sheltered areas of the Gulf of Riga ice formation started in the northeastern part around the 10th of January. The maximum ice extent was reached on February 15th. The timeliest ice chart issued by the BSH on February 12th is shown in Figure 11.
In the Bay of Bothnia restrictions for navigation regarding ice class and ship size/deadweight were in place from 27.12.2021. Later there were also restrictions in the Sea of Bothnia, the Gulf of Finland and the Gulf of Riga. Several icebreakers were deployed for navigational assistance. Navigational restrictions for the Saimaa Canal were in place from 02.01.2021 and from 08.01.2021 to 23.03.2021 the Saimaa Canal and Lake Saimaa were closed for traffic. The traffic separation scheme in the Quark was out of use between January 19th and April 9th. Transit traffic west of Holmöarna was prohibited from February 1st to March 29th.
5 Ice winter severity of the Baltic Sea
The ice winter severity for the entire Baltic Sea is determined by the maximum ice extent. This was reached on February 15th 2021 and was 127000 km2 according to the Swedish and Finnish Ice Service (SMHI and FMI, respectively). From the ice charts of the BSH the maximum ice extent was 120373 km2 . The differences in the ice extent stem from different land masks, differences in satellite data interpretation as well as different methods of determining the maximum ice extent, but the generally follow the same trend. This is shown by a time series of the maximum ice extent from the Finnish Ice Service and the BSH in Figure 12.
For the entire area covered by the ice charts issued from the BSH (Baltic Sea with the Swedish lakes Mälaren and Vänern, Skagerrak and North Sea up to the IJsselmeer) the maximum ice extent was reached on February 14th 2021 with 131424 km2 .
6 Reporting of the BSH
The BSH informed about ice conditions and expected ice development in the entire Baltic Sea and German coastal waters by the following reports and ice charts:106 Ice reports (Amtsblatt, official report issued Monday - Friday)
19 German Ice Reports (Information about ice conditions in German fairways)
19 Baltic Sea reports (detailed description of the ice situation along the German Baltic Sea coast)
14 North Sea reports (detailed description of the ice situation along the German Baltic Sea coast)
21 Weekly reports (Review and outlook of the ice situation)
21 Ice charts of the entire Baltic Sea (once per week)
12 Ice charts of the German coastal areas and Skagerrak (up to daily)
11 Ice charts of the German Baltic Sea coast (up to daily)
7 Bibliography
[1] Deutscher Wetterdienst, 2021: Deutschlandwetter im Winter 2020/21 [Pressemeldung], https://www.dwd.de/DE/presse/pressemitteilungen/DE/2021/20210226_deutschlandwetter_winter2020_2021_news.html
[2] Koslowski, G., 1989: Die flächenbezogene Eisvolumensumme, eine neue Maßzahl für die Bewertung des Eiswinters an der Ostseeküste Schleswig-Holsteins und ihr Zusammenhang mit dem Charakter des meteorologischen Winters. Dt. hydrogr. Z. 42, 61-80
[3] Nusser, F., 1948: Die Eisverhältnisse des Winters 1947/48 an den deutschen Küsten. Dt. hydrogr. Z. 1, 149–156
Appendix
A. Ice conditions at the German coasts
B. Baltic Sea ice codes German stations