The ice winter 2023/2024 at the German coasts and the Baltic Sea
Wiebke Aldenhoff
Table of Content
- 1 Overview of the ice winter 2023/34
- 2 The ice winter at the German North Sea and Baltic Sea coasts
- 2.1 Weather conditions at the German coastal areas
- 2.2 Ice conditions at the German North Sea and Baltic Sea coasts
- 2.3 Navigational conditions at the German North Sea and Baltic Sea coasts
- 2.4 Ice winter severity
- 3 Ice conditions in the western and southern Baltic Sea, Kattegat and Skagerrak
- 4 Ice conditions in the northern Baltic Sea
- 5 The ice winter 2023/34 in long-term comparison
- 6 Reporting of the BSH
- Bibliography
- Appendix
1 Overview of the ice winter 2023/34
The ice winter 2023/24 at the German North Sea and Baltic Sea coast was a weak ice winter and the thirteenth too warm winter in a row. Although there were in total three short cold periods in the beginning of December 2023 and in January 2024, ice only formed in coastal and sheltered areas. With exemption of the Szczecin Lagoon where thin ice formed slightly offshore. Navigation was not noteworthy impeded by the thin ice.The ice winter in the entire Baltic Sea was likewise a weak ice winter regarding the maximum ice extent. However, the maximum ice extent was larger than the past five winters. In the northern part, the ice season lasted from the end of November 2023 until June 2024 and was therefore longer than usual. Intrusions of warm air and southerly winds prevented that the ice winter got more severe. Ridges created by the wind posed a challenge at places for navigation in the Bay of Bothnia. Further south the ice season also started earlier than usual at many places but also ended earlier.
2 The ice winter at the German North Sea and Baltic Sea coast
2.1 Weather conditions at the German coastal areas
The winter 2023/24 was the thirteens mild winter in a row according the German Weather Service and the third warmest since records began [1]. This is reflected by the monthly mean temperatures and their deviation from the reference period 1981–2010 for the stations Norderney, Schleswig, Warnemünde and Greifswald from November 2023 to March 2024 as shown Table 1. The monthly mean temperatures were above the reference period for all months, with February being more than 4 °C warmer than the reference values for all stations. November to January the deviations ranged from 0.4 °C to 2.2 °C and March was up to 3.1 °C warmer than the reference period. With a cold sum below 100 all four winters are meteorological mild winters.
| November | December | January | February | March | ||||||
|---|---|---|---|---|---|---|---|---|---|---|
| T [°C] | ΔT | T [°C] | ΔT | T [°C] | ΔT | T [°C] | ΔT | T [°C] | ΔT | |
| Norderney | 7.80 | 1.20 | 5.70 | 2.20 | 3.90 | 1.30 | 6.80 | 4.20 | 7.60 | 2.70 |
| Schleswig | 5.40 | 0.40 | 3.70 | 1.70 | 2.30 | 1.00 | 5.60 | 4.20 | 6.60 | 2.80 |
| Warnemünde | 6.60 | 1.00 | 4.20 | 1.80 | 2.90 | 1.40 | 6.00 | 4.20 | 7.30 | 3.10 |
| Greifswald | 5.50 | 0.80 | 3.40 | 2.00 | 2.20 | 1.60 | 5.70 | 4.70 | 6.70 | 3.00 |
Despite the overall warm winter, there were three shorter cold periods, one at the end of November/beginning of December and two in the second and third week of January, when permanent frost was not unusual along the German coast. This is shown by the daily mean temperatures of the stations Norderney, Schleswig, Warnemünde and Greifswald in Figure 1. Days with daily mean temperatures below 0 °C are highlighted in blue. At the end of November, daily mean temperatures below 0 °C occurred for the first time at the North Sea and Baltic Sea coasts. The influx of colder air of polar origin caused a temperature drop and permanent frost occurred at places. In the eastern part, the colder weather lasted until 7 December 2023 before daily mean temperatures increased to around 0 °C. The daily mean temperatures were well above 0 °C after 10 December 2024 for all stations. The rest of December was mild and first after the turn of the year cold air of polar origin caused once more a cold period after 4 January 2024 that spread from the north of Schleswig-Holstein to southeast. Milder weather prevailed after 11 January 2024 and daily mean temperatures were temporarily above 0 °C. From 15 January 2024 until 19 January 2024, the daily mean temperatures except for the East Frisian islands sank once more below 0 °C. The rest of January was significantly warmer. Throughout the rest of the winter, there were no more frost periods and the daily mean temperatures remained well above 0 °C.
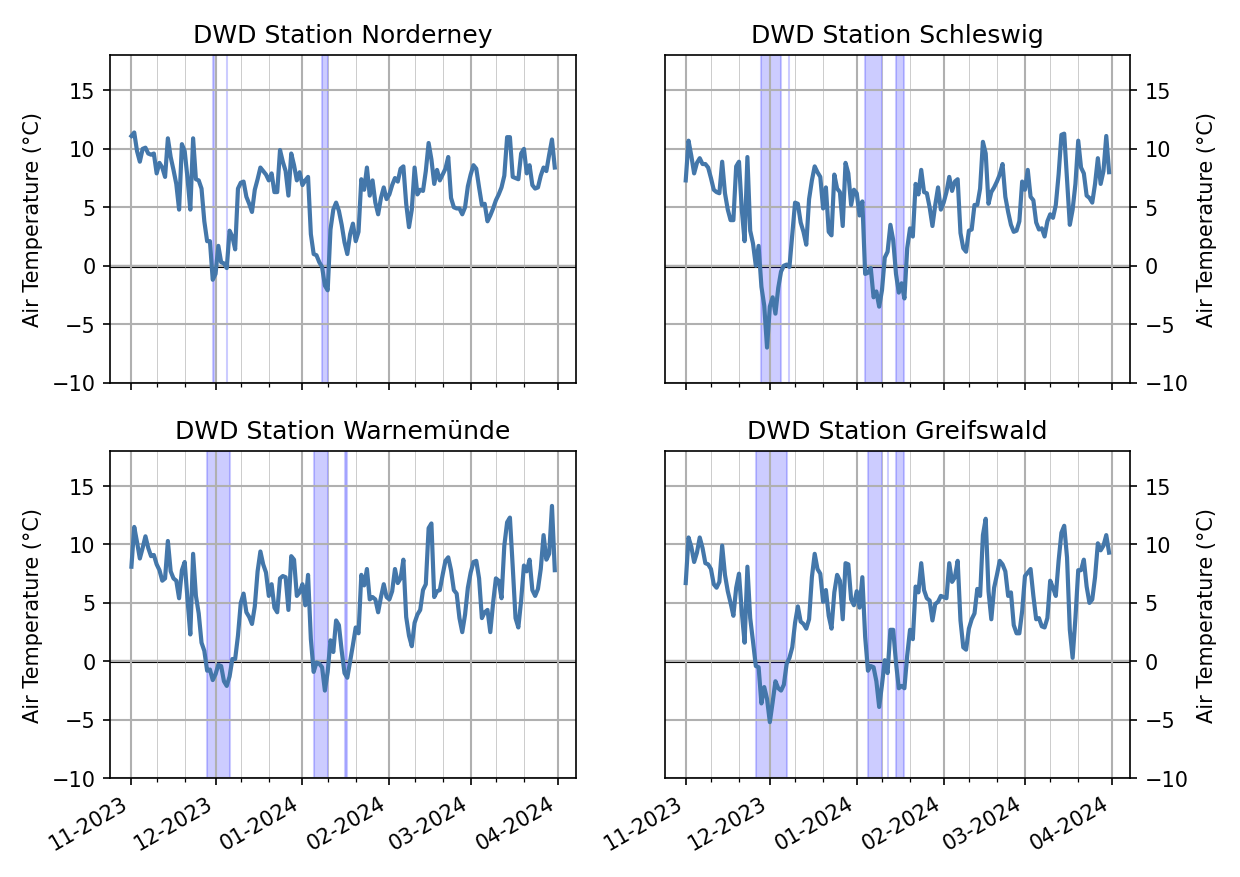
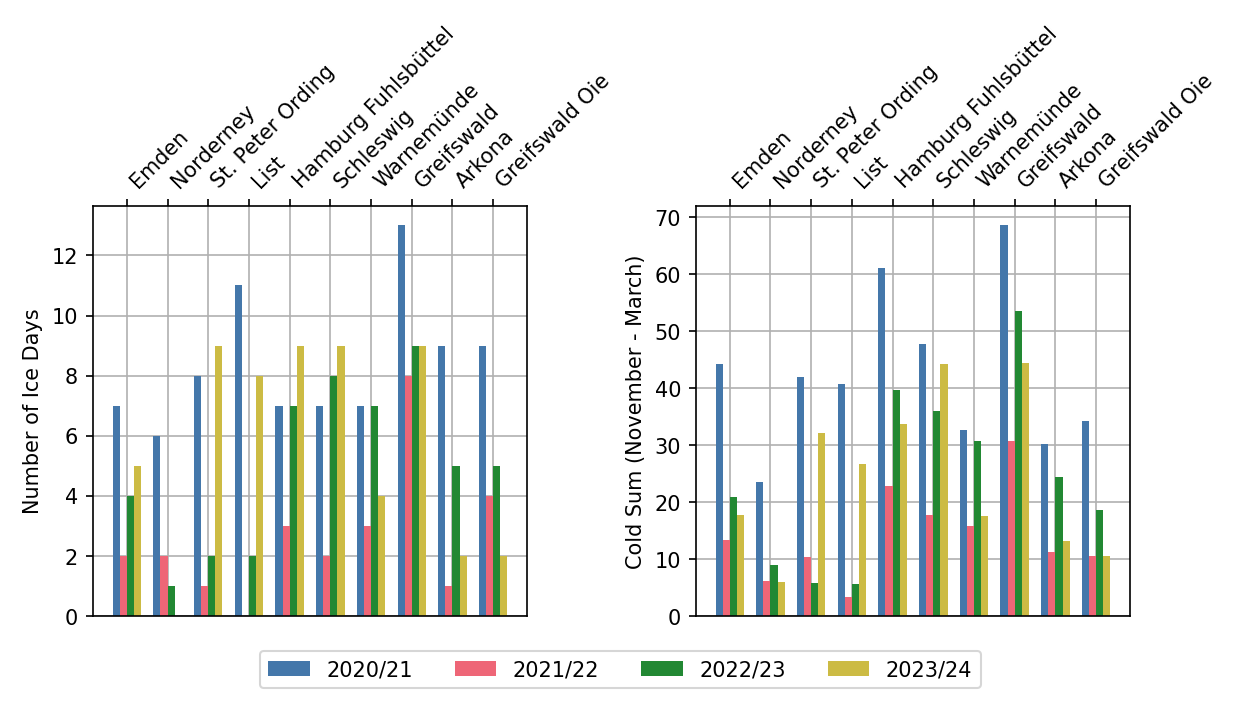
Figure 2 shows the number of ice days, days with maximum temperature below the freezing point, and the cold sum, absolute value of the negative daily mean temperatures, of the stations Emden, Norderney, List, St. Peter Ording, Hamburg Fuhlsbüttel, Schleswig, Warnemünde, Greifswald, Arkona and Greifswalder Oie for the last four winters. Despite the rather mild winter, there were more ice days along the North Sea coast except for the East Frisian islands. For the stations Hamburg Fuhlsbüttel and Schleswig that are located more inland there were the most ice days of the four past winters. Along the eastern Baltic Sea coast there were mostly fewer ice days than in the preceding ice winter and the winter 2020/21, but often more than in the winter 2021/22. This trend is also reflected in the cold sum but the winter 2020/21 had the largest cold sum at all stations.
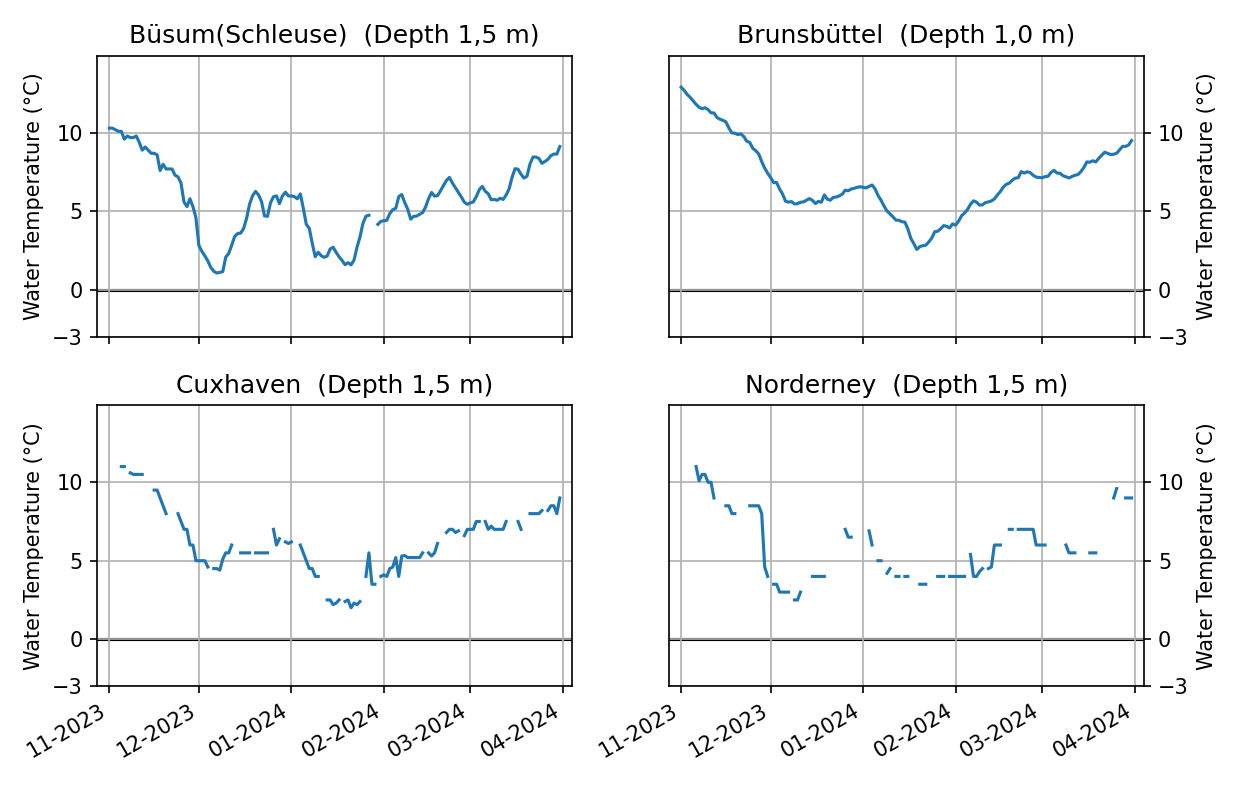
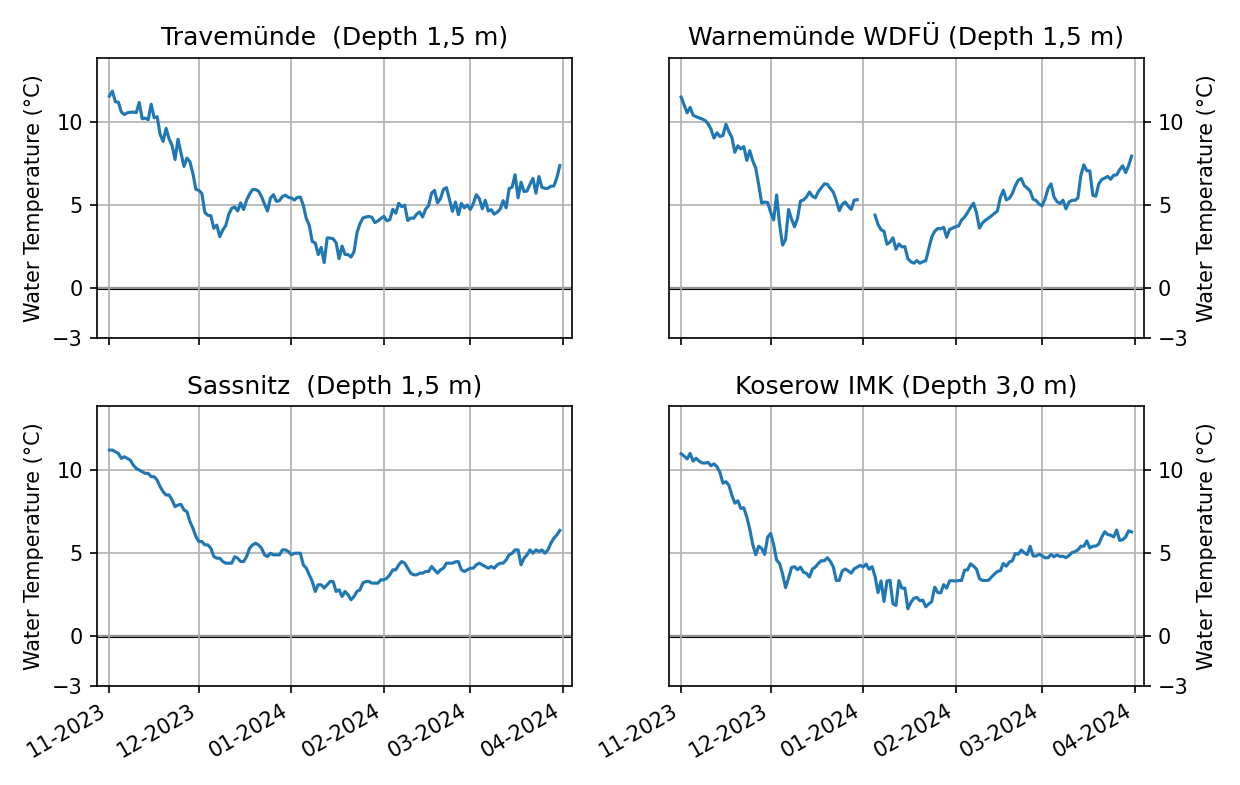
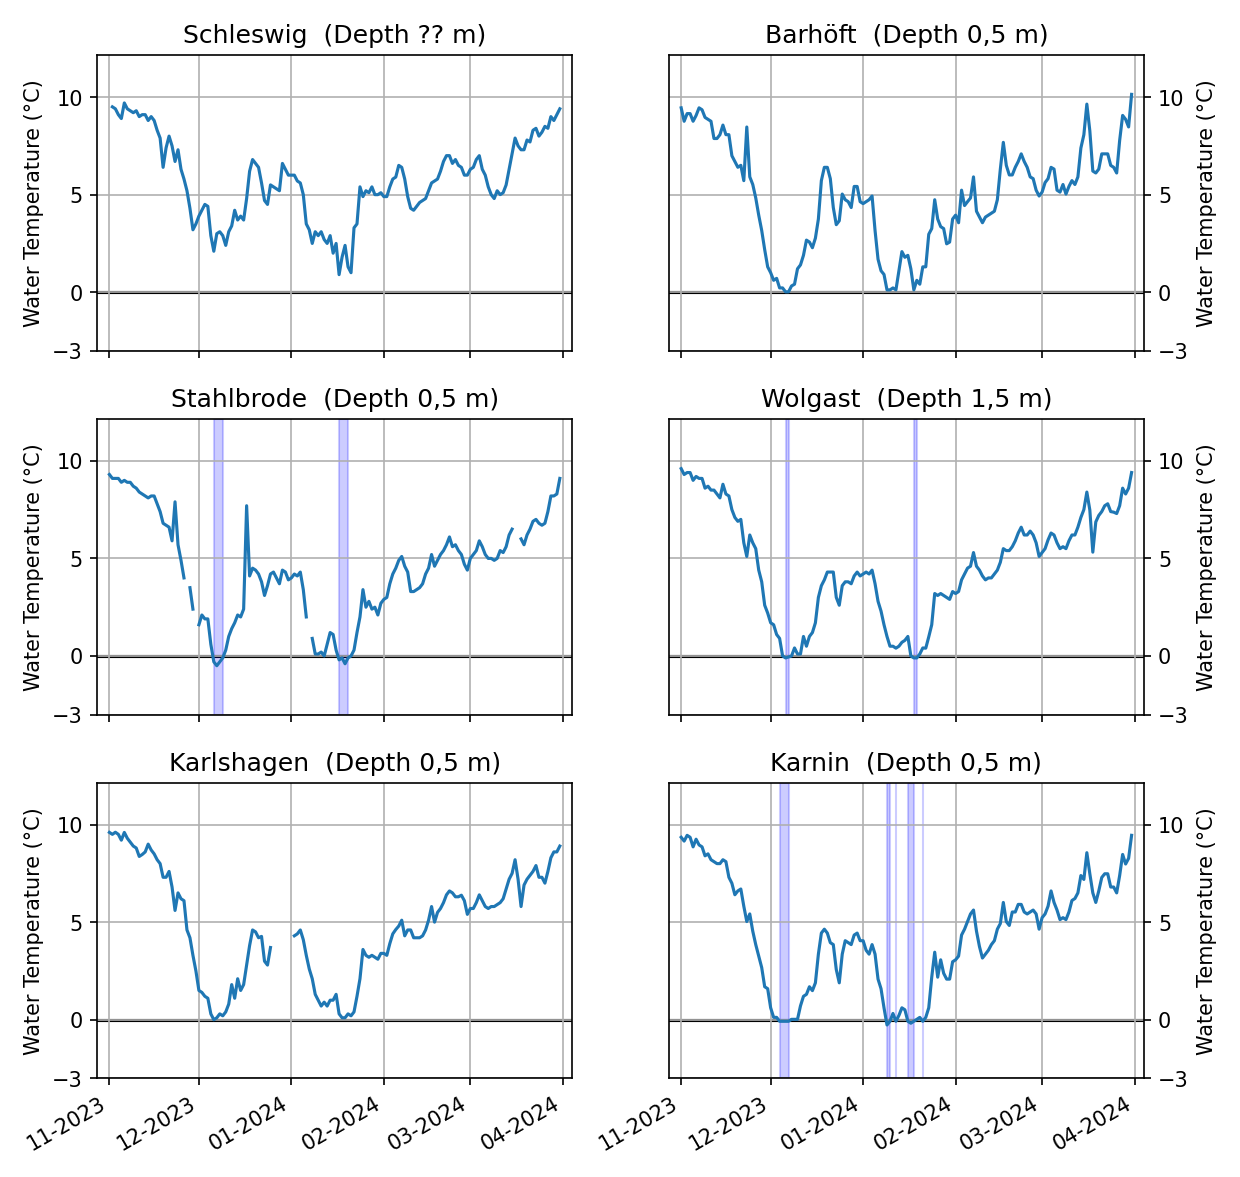
The course of the air temperatures is also reflected in the water temperatures at several stations along the North Sea and Baltic Sea coast as shown in Figure 3. During November, water temperatures at all stations continuously sank often below 5 °C. With the start of the cold period at the end of November, the water temperatures decreased even more especially in the Baltic Sea. In the lagoon and bodden areas of the Darß, around Rügen and the Szczecin Lagoon water temperatures around 0 °C were measured. With the end of the cold period water temperatures increased significantly especially in sheltered lagoon and bodden areas. Along the outer coast, variations in water temperature were less. During the further course of December, water temperatures remained around 5 °C before they were falling again with the next cold period in the beginning of January. Especially along the outer coast water temperatures dropped below the levels of December but remained above 0 °C. The temporary warmer air temperatures mid January are also reflected in the water temperatures. With the end of the cold period at the end of the third week of January, water temperatures steadily increased during the winter.
2.2 Ice conditions at the German North Sea and Baltic Sea coasts
The ice winter 2023/24 along the German coasts was despite three cold periods in the beginning of December and in January a weak ice winter that started comparatively early. During the ice periods, ice formed only temporarily in sheltered coastal areas while the open sea remained ice-free. Due to the short duration of the ice periods, no thicker ice could form and the ice vanished quickly with increasing temperatures. With exception of the harbour in Emden, only minor ice formed around the North Frisian islands of the North Sea. Along the Baltic Sea coast ice occurred in sheltered places along the entire coast but with exemption of the Schlei only occasionally along the coast of Schleswig-Holstein.
The first ice of the season was reported on 30 November 2023 for the inner Schlei, in Dranske at the west coast of Rügen and the Listertief north of the island Sylt in the North Sea. The following days ice formed increasingly in the Peenestrom, in sheltered bays of the Szczecin lagoon, in the bodden water around Rügen and at places in the Darß-Zingst-Bodden-Chain and the harbour of Wismar. Thicker ice only formed near Rankwitz in the Peenestrom and close to Ueckermünde. With increasing temperatures from 8 December 2023, the mainly thin ice vanished quickly. At 13 December 2023 the coasts were ice-free with the last ice vanishing in Rankwitz. At the North Sea ice was only reported for the Listertief at some days between 30 November 2023 and 8 December 2023. The early occurrence of ice at the turn of the month November/December 2023 is comparatively to the long-term median of the years 1961–2010 early but not unique.
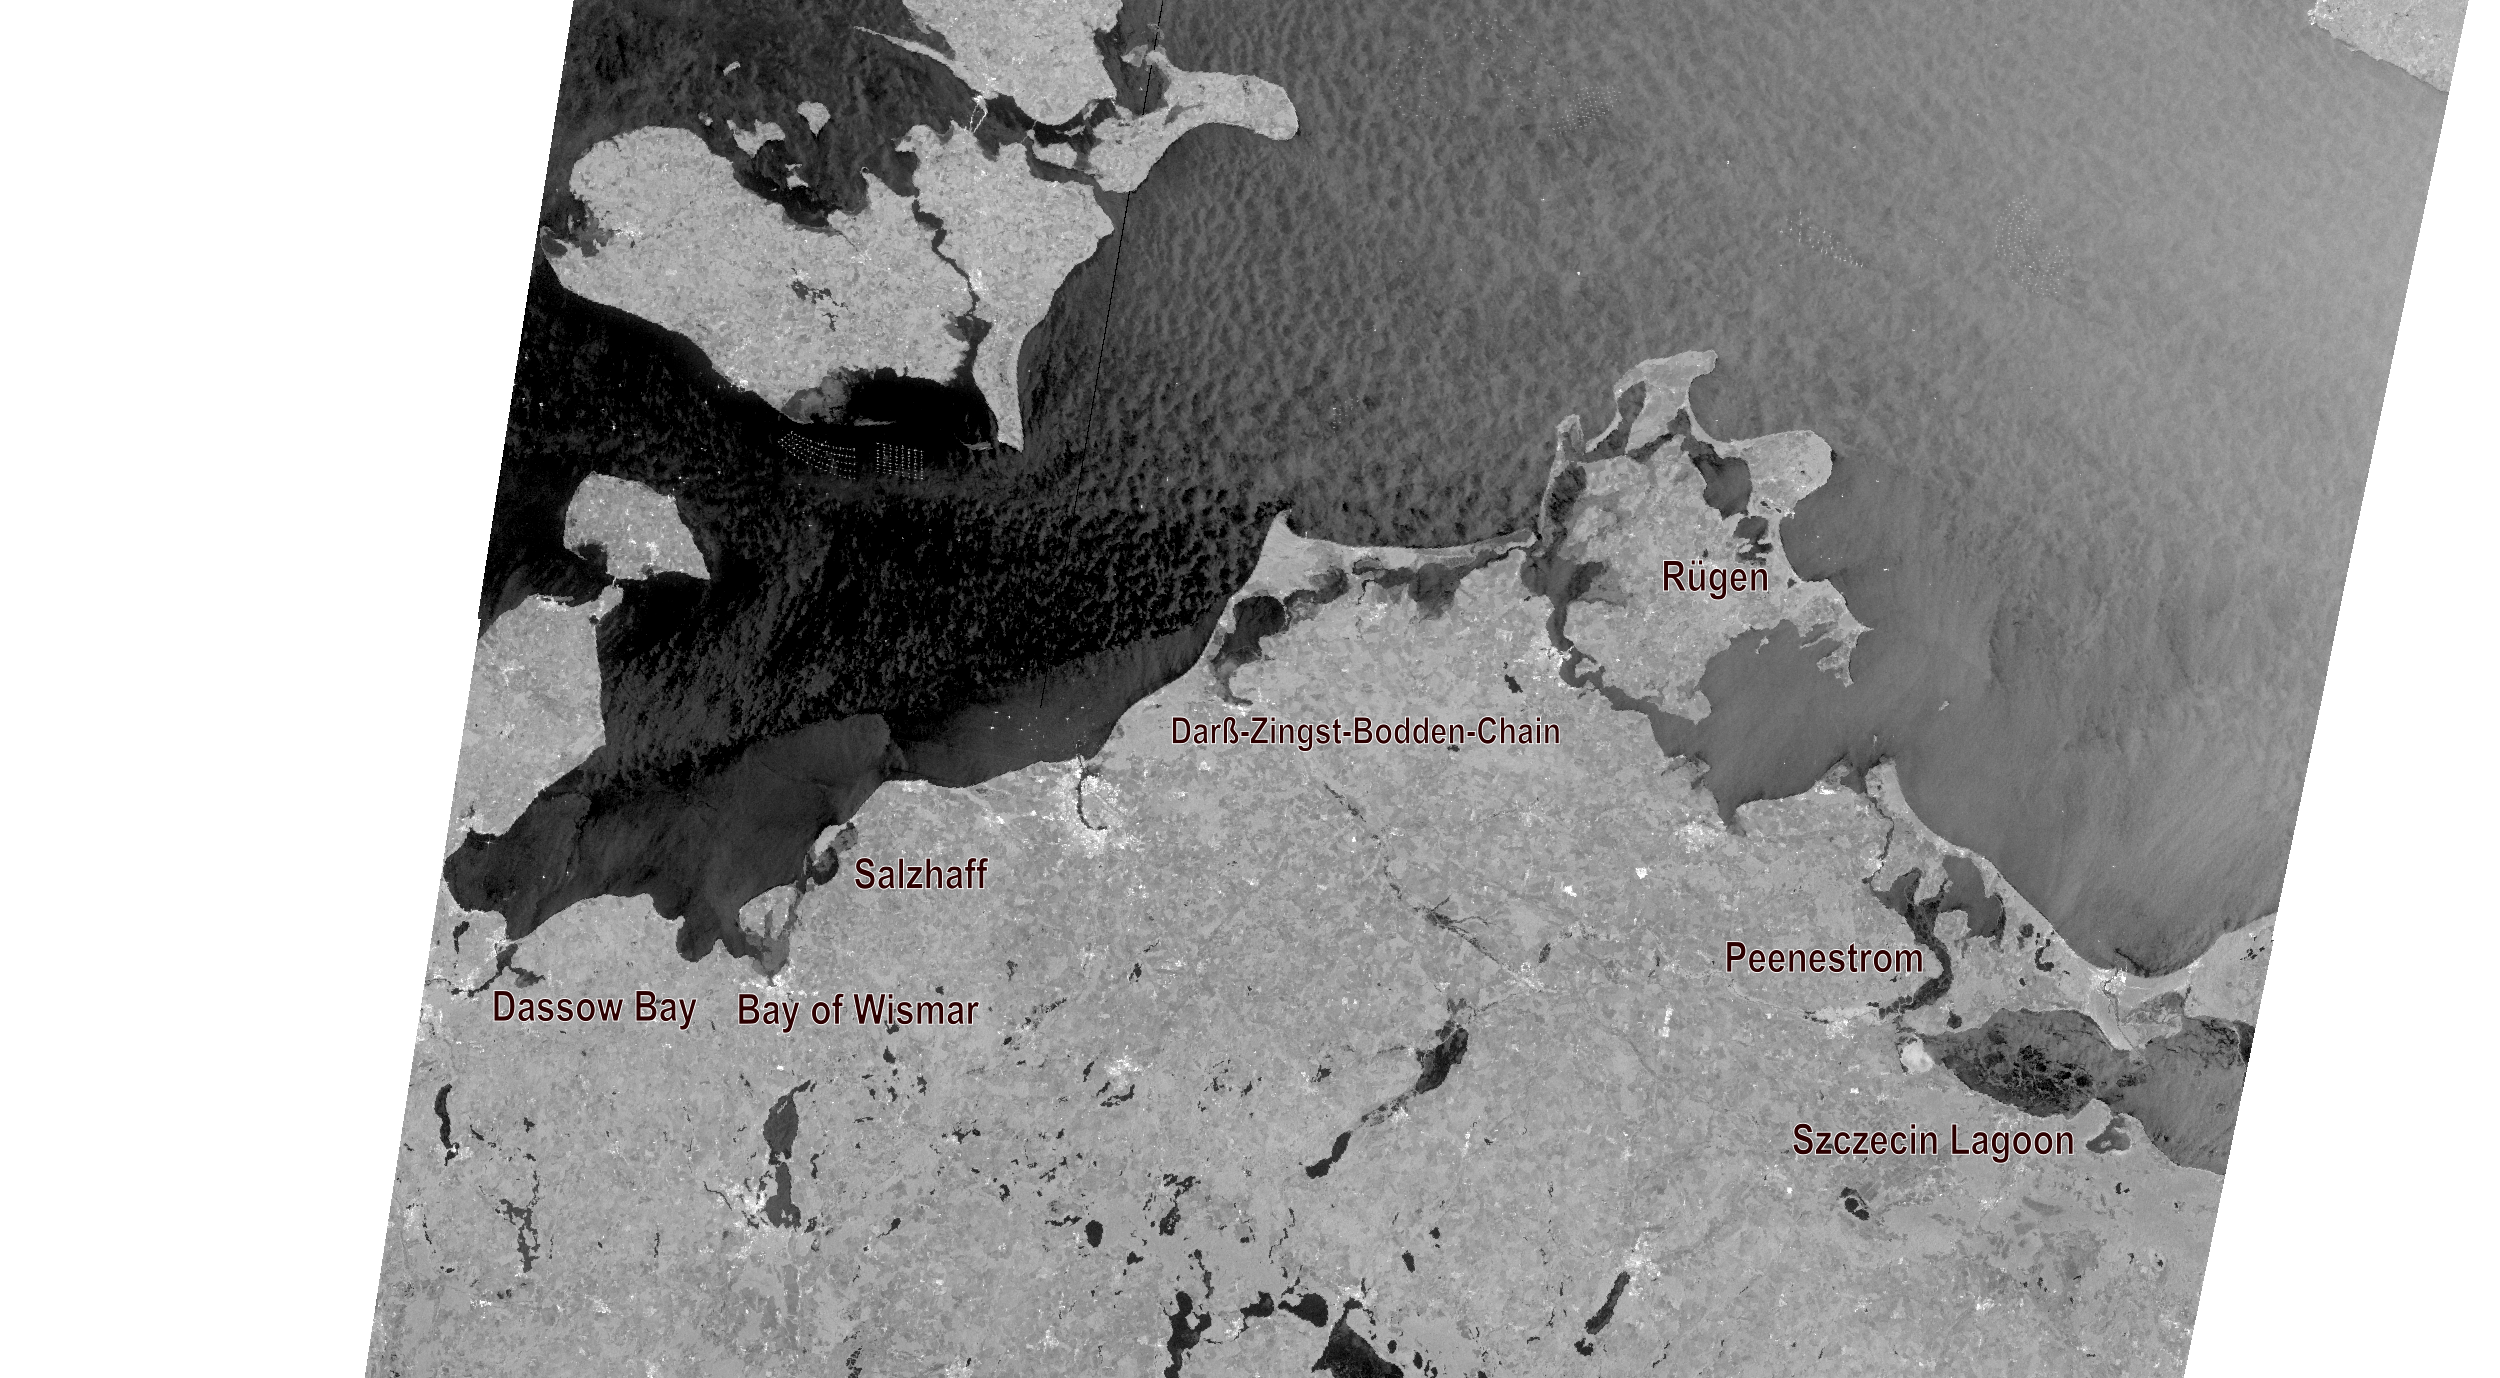
Ice formation along the coast started again with the second cold period of the winter on 9 January 2024. The second ice period also lasted only a few days before warmer temperatures temporarily melted the still thin ice. Figure 7 shows a Sentinel-1 radar image of the Baltic Sea coast from the Bay of Lübeck to the Szczecin Lagoon taken the early morning 10 January 2024. Ice formation is visible in the Dassow Bay at the mouth of the river Trave, the Bay of Wismar, the Salzhaff, along the southern coast of the Darß-Zingst-Bodden-Chain and the western bays of Rügen. The ice in the image appears brighter and smoother in texture compared to the surrounding water. In the Peenestrom and the southwestern and northeastern part of the Szczecin Lagoon ice formation is also visible. However, at those places the ice appears darker than the surrounding water and has more texture as ice formation is not uniform across the sea. The radar image usually represents the roughness of the surface. Rough surfaces reflect more electromagnetic radiation back to the radar than smooth surfaces. Thus, smooth surfaces appear dark and rough surfaces bright in the image. Ice that forms at the sea can be rough or smooth depending on the circumstances of formation and the thickness of the ice. If ice forms at the sea, the roughness is usually reduced compared to non ice-covered water as a thin, smooth ice layer forms that dampens the small surface ripples of the water. Wind that forces this layer to break up or not freeze evenly and smaller pieces to collide causes a rougher ice surface. Unfortunately, natures behaviour is seldom so simple so that the interpretation of radar images for sea ice not only requires training but also the consideration of the spatial context of the image and the weather conditions of the past days. Temperatures increased from west to east after 11 January 2024 and the thin ice quickly vanished. The coast was ice-free on 13 January 2024. There was no noteworthy ice formation along the North Sea coast during this cold period. The ice-free time was short-lived and from 16 January 2024 the last ice for this winter formed in sheltered places along the entire Baltic Sea coast. At the North Sea minor ice formed in the harbour of Emden and around the North-Frisian islands, but it remained open water. In Kamminke located in the western part of the Szczecin Lagoon the last ice was observed on 23 January 2024. Most of the ice especially along the western coast was mostly gone by 20 January 2024.
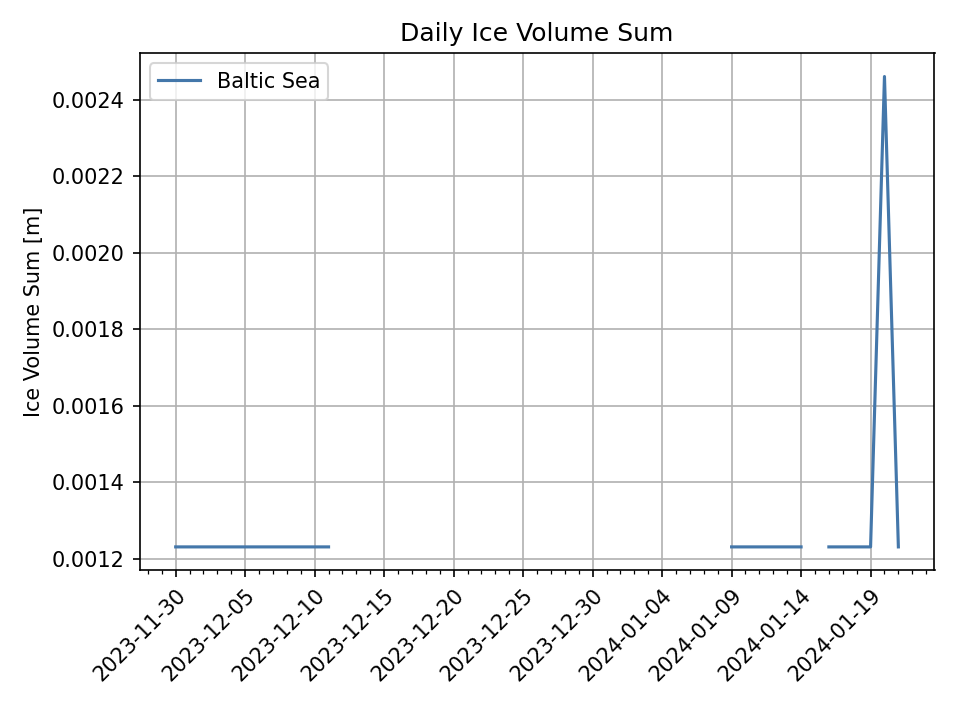
The mild ice winter is also reflected in the daily areal ice volume sum. The areal ice volume sum is a measure to determine the ice winter strength that depends on the ice thickness, the ice concentration and the duration of the ice occurrence [3]. The ice volume sum is calculated at 13 ice climate stations along the North Sea and Baltic Sea coast, respectively. Along the North Sea coast, the following stations are used for the calculation: Borkum/Westerems, Emden (Ems and outer harbour), Norderney/Seegat, Wangerooge/wadden, Lighthouse Hohe Weg, Brake (Weser), Helgoland, Stadersand/Elbe, Brunsbüttel, Hamburg/Landungsbrücken, Husum (harbour), Amrum/Schmaltief and Tönning (harbour). Along the Baltic Sea coast, the following stations are used: Koserow, Arkona, Landtiefrinne, Vierendehlrinne, Warnemünde/sea area, Rostock-Warnemünde, Walfisch-Timmendorf, Travemünde-Lübeck, Marienleuchte/sea area, Westermarkelsdorf/sea area, Eckernförde (harbour), Schleimünde-Schleswig and Flensburg-Holnis.
2.3 Navigational conditions at the North Sea and Baltic Sea coasts
Navigation was not noteworthy impeded along the German coasts in the winter 2023/24 due to the short freezing periods and therefore thin ice thickness.
2.4 Ice winter severity
The ice winter severity along the German coasts is determined by the accumulated areal ice volume sum of 13 ice climate stations for the North Ses and Blatic Sea (see 2.2). The ice winters are than classified in five categories: weak, moderate, severe, very severe and extremely severe. The accumulated ice volume sum in the winter 2023/24 is shown in Figure 9. The three ice periods are distinguished by the steps of constant ice volume sum. With an accumulated ice volume sum of 0.03 m and 0 m along the Baltic Sea coast and North Sea coast respectively, the ice winters at both coasts were weak ice winters. They were the twelfth weak ice winters in a row along the German coasts.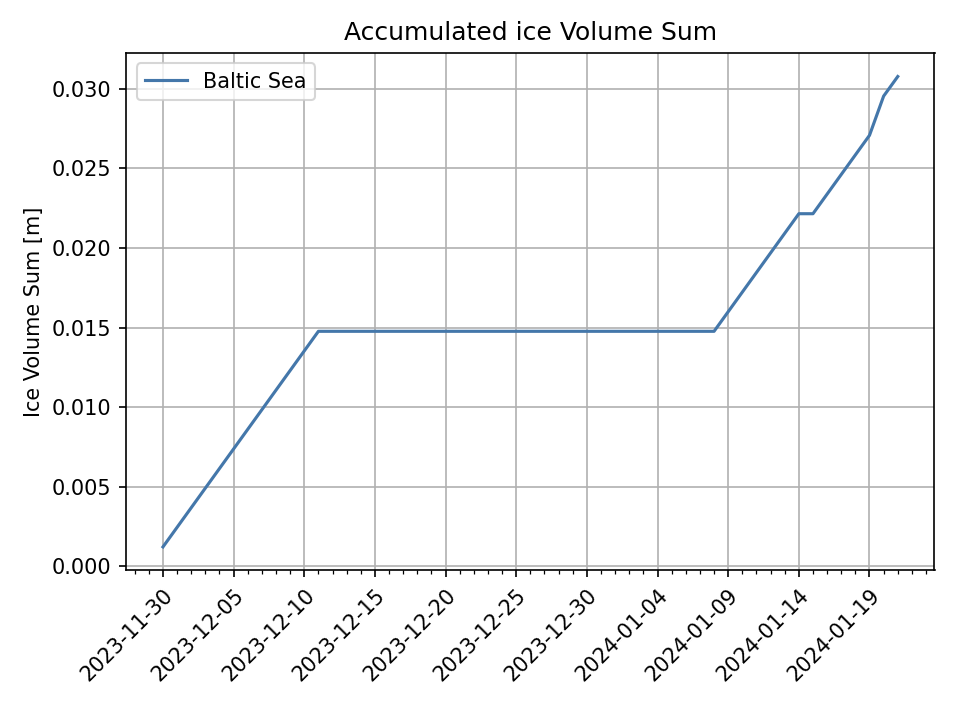
3 Ice conditions in the western and southern Baltic Sea, Kattegat and Skagerrak
In the Skagerrak and Kattegat ice occurred only in sheltered areas and in the inner archipelagos along the coast during the course of the winter. Ice formation started at the end of November/beginning of December 2023 and most of the ice was gone by the beginning of March. At places along the Norwegian coast ice was present until the last third of March. Along the Danish islands and the mainland ice formed at sheltered places only during the frost period in January. Along the southern Swedish coast there was some thin ice during the cold periods in December and January especially in the archipelagos around Karlskrona. In the Vistula Lagoon and the Curonian Lagoon, ice formation started end of November. Most of the ice was gone by the end of the second third of December before new ice formed at the beginning of January. Most of the ice was gone in Vistula lagoon be the beginning of February and in the Curonian was only some minor ice left at places. No new ice formation occurred during the remainder of the winter.
4 Ice conditions in the northern Baltic Sea
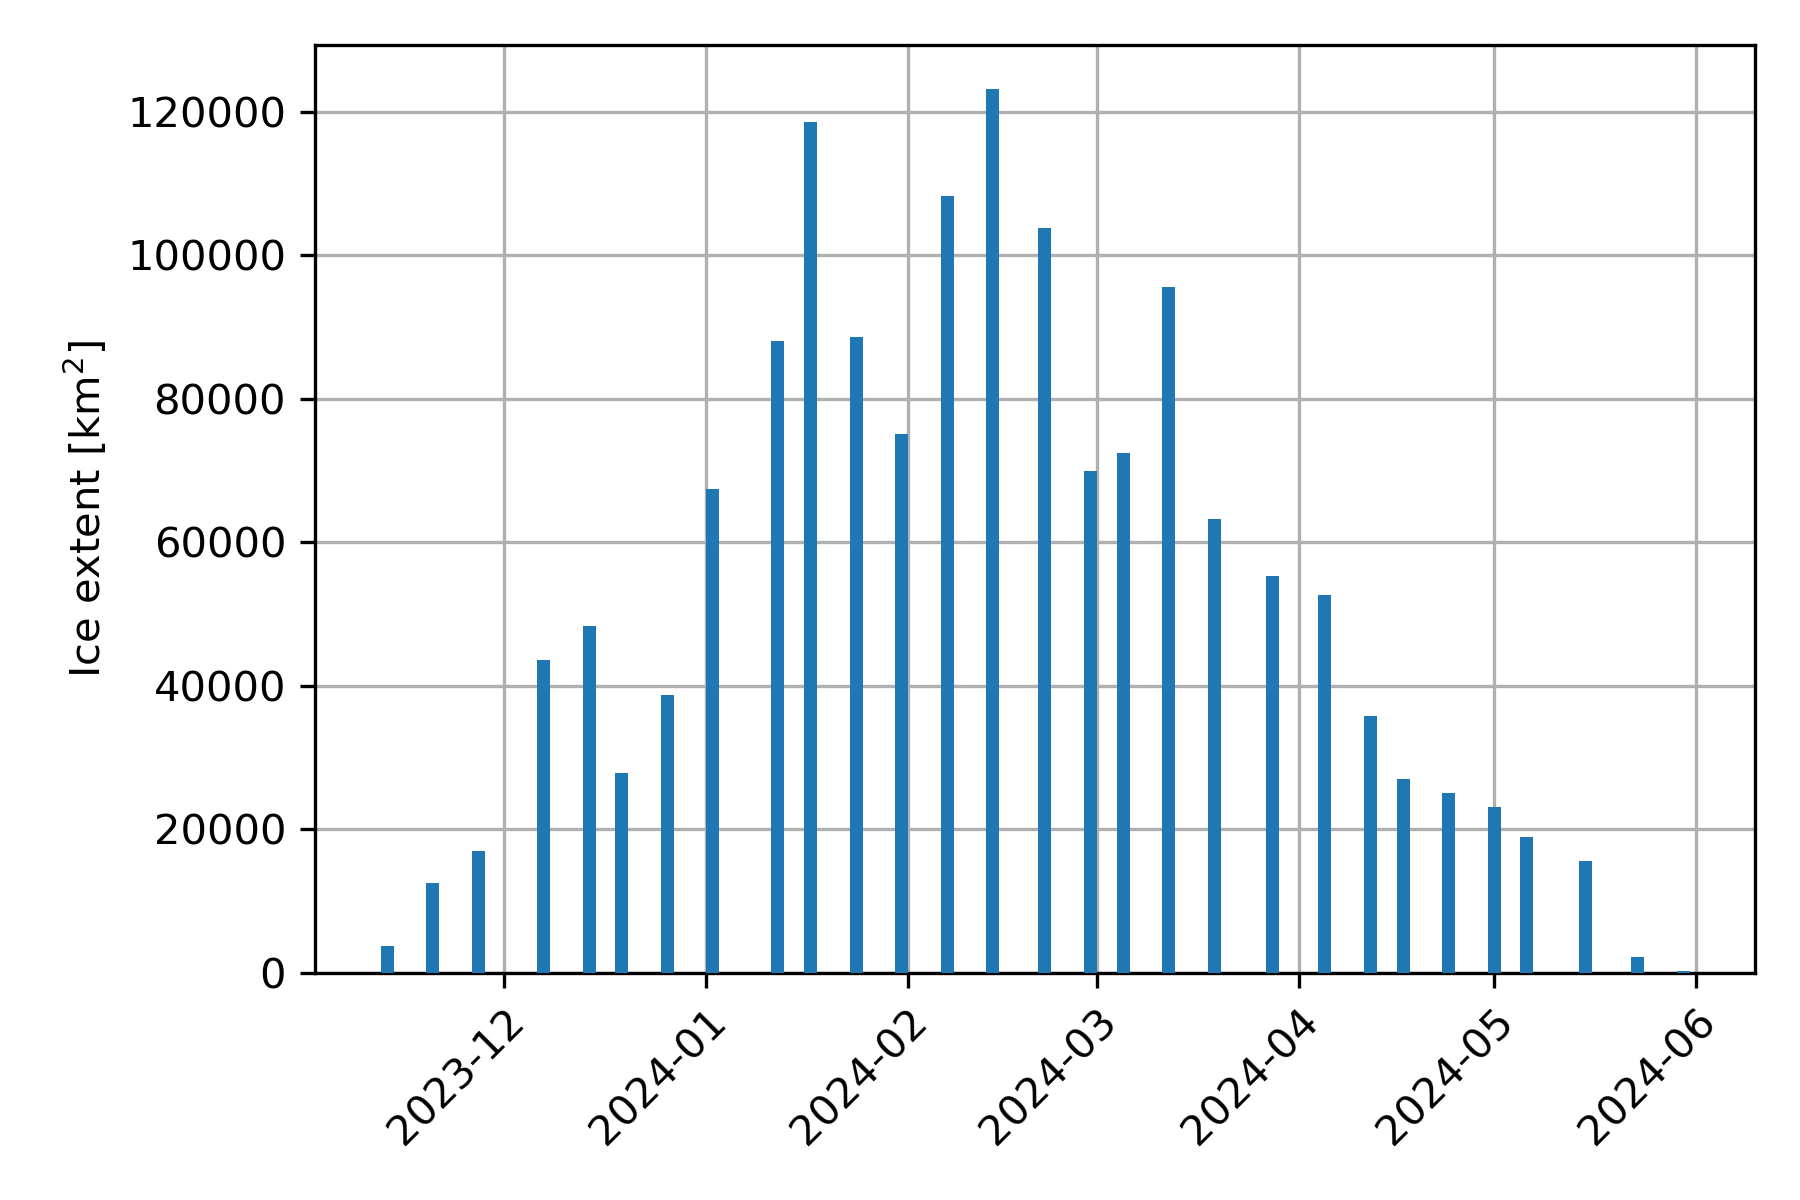
The ice winter in the entire Baltic Sea was a long ice winter from the end of October 2023 to beginning of June 2024. Regarding the maximum ice extent it was a weak ice winter but the extent was the largest of the last six winters.
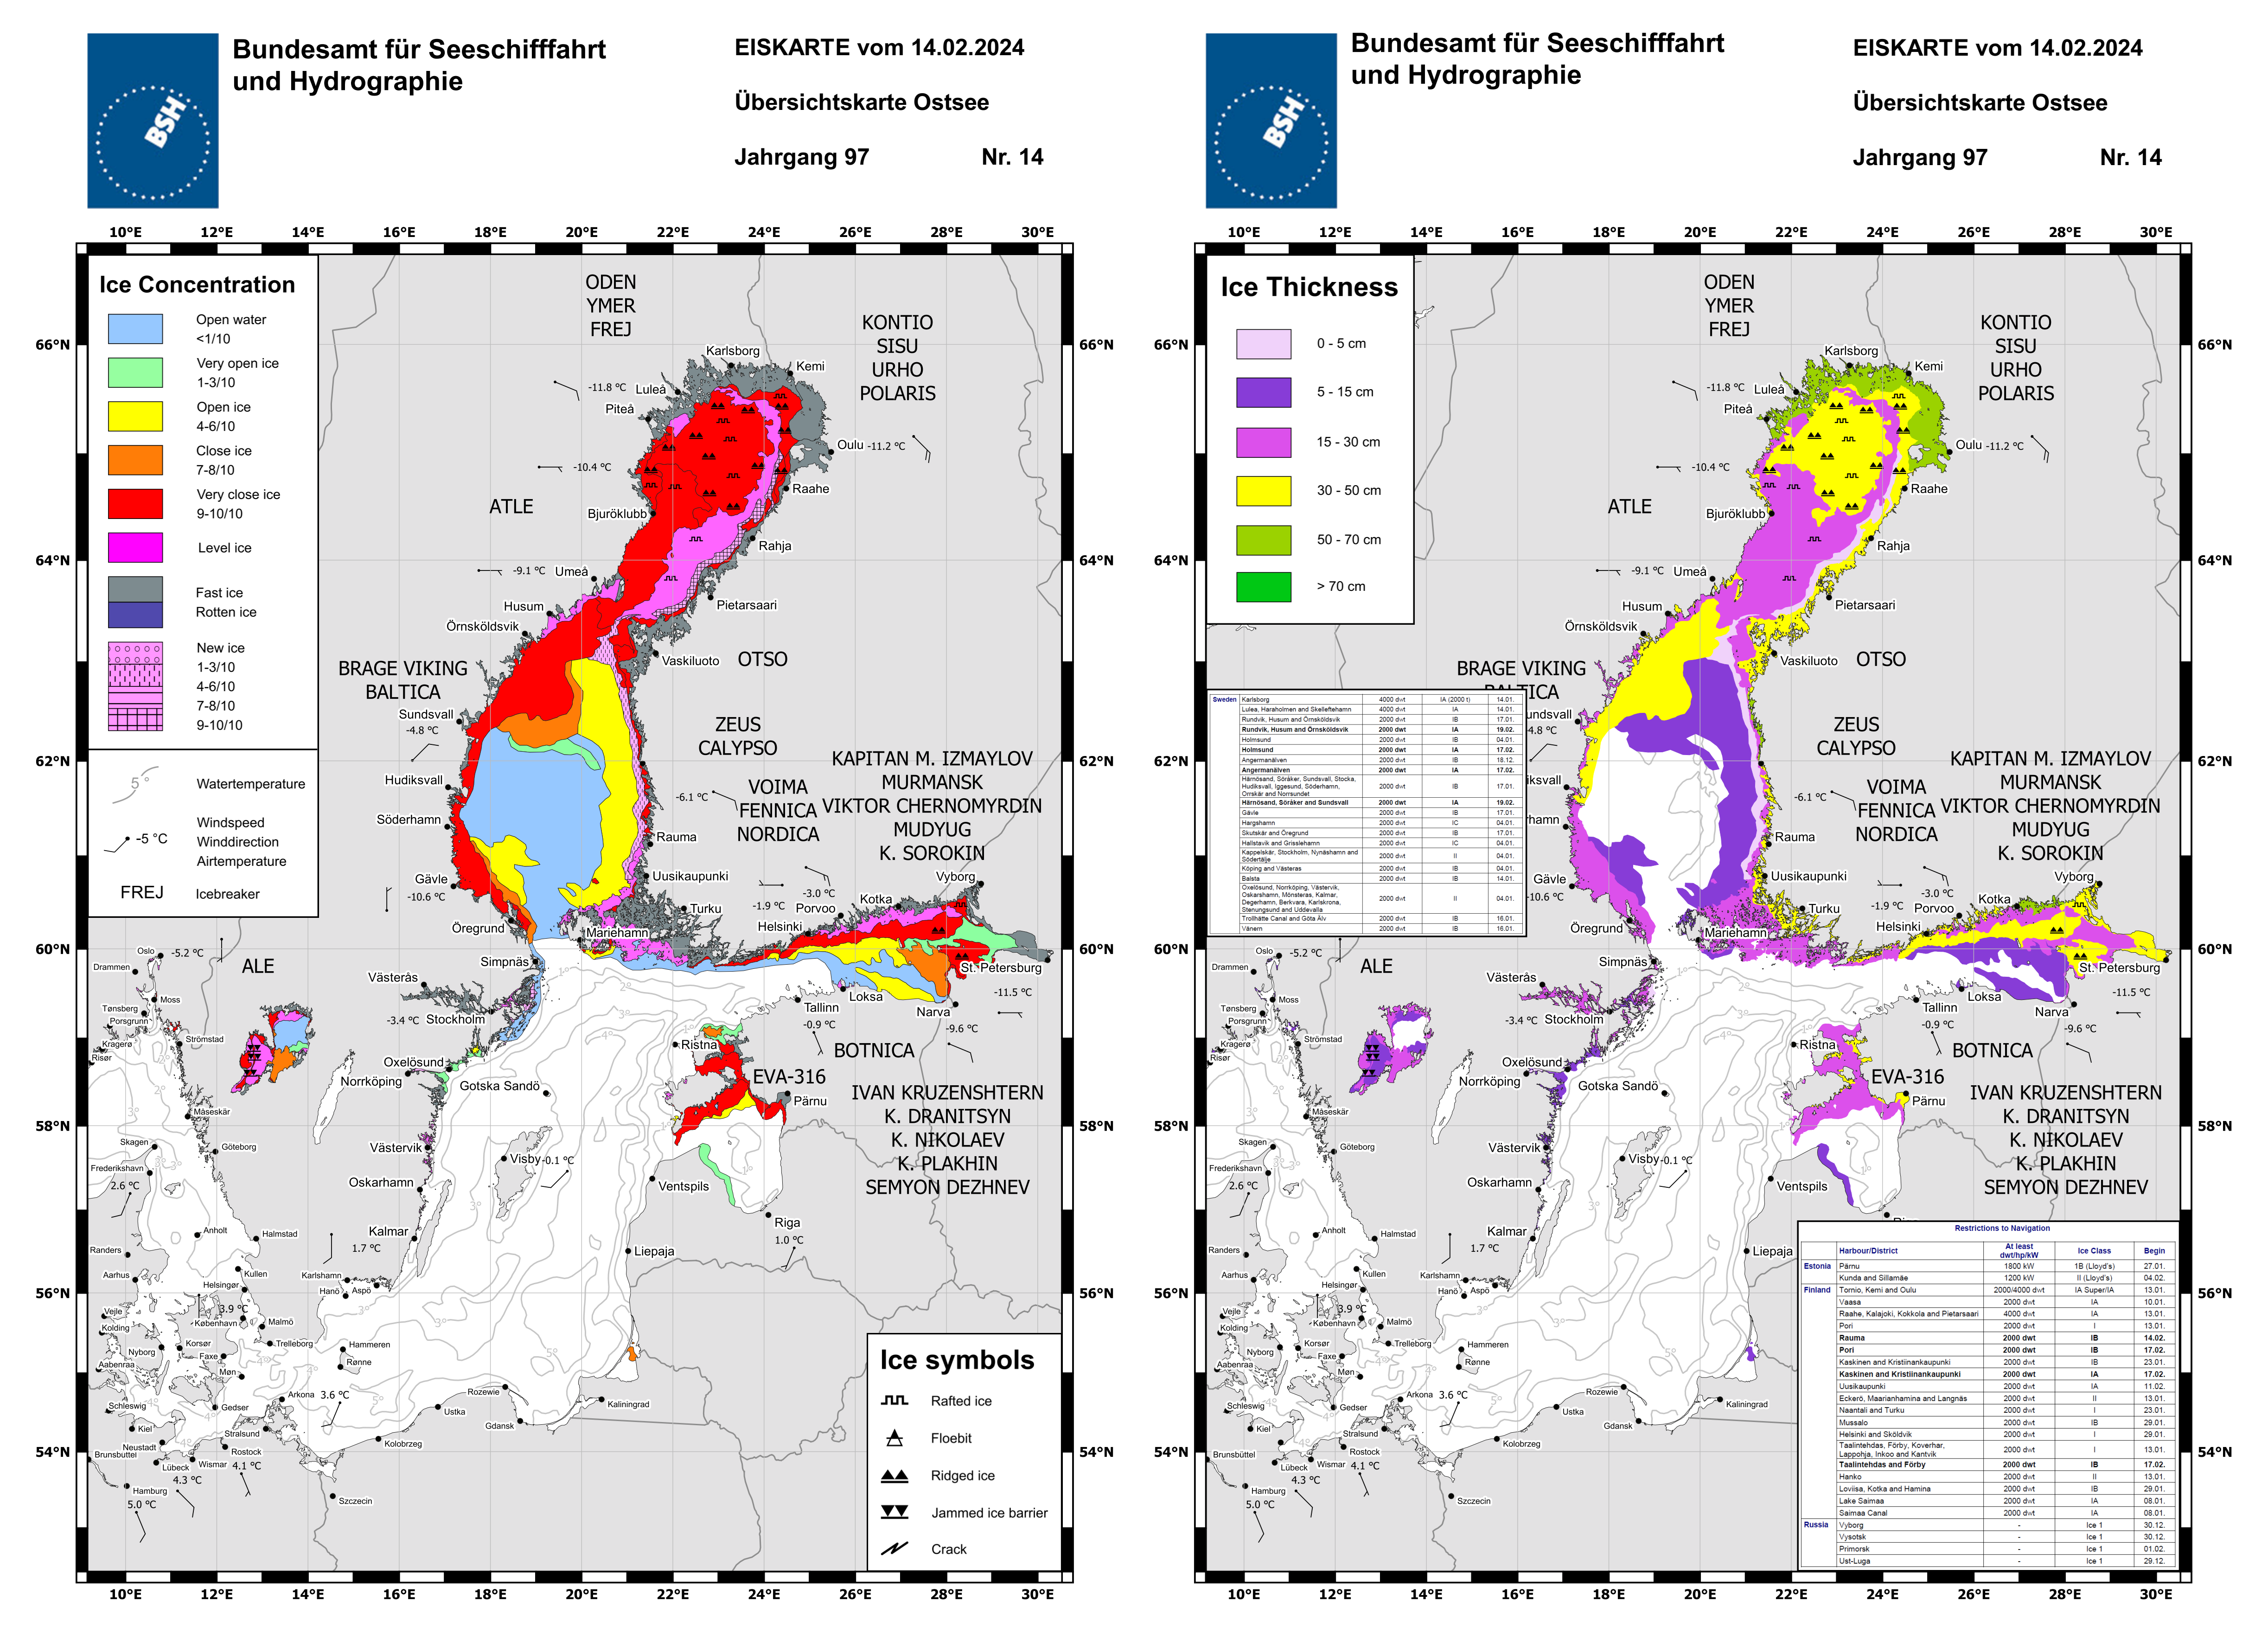
The first ice in the archipelagos of the northern Bay of Bothnia formed around 22./23. Oktober 2023. In November the coastal ice stretched to Norra Kvarken in the south and ice formation further out at sea started in the northern part. End of November/beginning of December ice formation occurred along the entire coast south into the Archipelago Sea and Åland Sea as well as in the Gulf of Finland and the Gulf of Riga. Somewhat later ice formation also started further south along the Swedish coast. In the second half milder weather in the entire Baltic Sea region caused a decline in sea ice cover. End of December the temperatures dropped and in the beginning of January very severe frost was observed as south as the Gulf of Riga so that the ice cover quickly grew in all coastal areas as well as at sea in the northern part. On 3 January 2024 the Bay of Bothnia and Norra Kvarken were completely covered by ice. In the Gulf of Finland ice formed increasingly at sea in the eastern part and off the northern coast until mid January. With the end of January milder weather with temperatures partly around 0 °C in the north became dominant and southwesterly winds compressed the ice along the coasts in the Bay of Bothnia and the Gulf of Finland. The ice extent decreased significantly during this period. From 5 February 2024 temperatures dropped in the entire northern Baltic Sea area and the ice cover increased quickly with ice forming at sea in the Bay of Bothnia, Norra Kvarken, northern Sea of Bothnia and the Gulf of Finland. The maximum ice extent was reached on 12 February 2024. Figure 12 shows the ice chart of the BSH from 14 February 2024.
Restrictions for navigation were in force from 22 November 2023 to 31 May 2024 in the northern Bay of Bothnia. At times there were also restrictions in the Sea of Bothnia, the Åland Sea, the Archipelago Sea, the Gulf of Finland, the Gulf of Riga and along the Swedish coast to Karlskrona in the south as well as at places in the Skagerrak and Lake Vänern.
5 Ice winter severity of the Baltic Sea
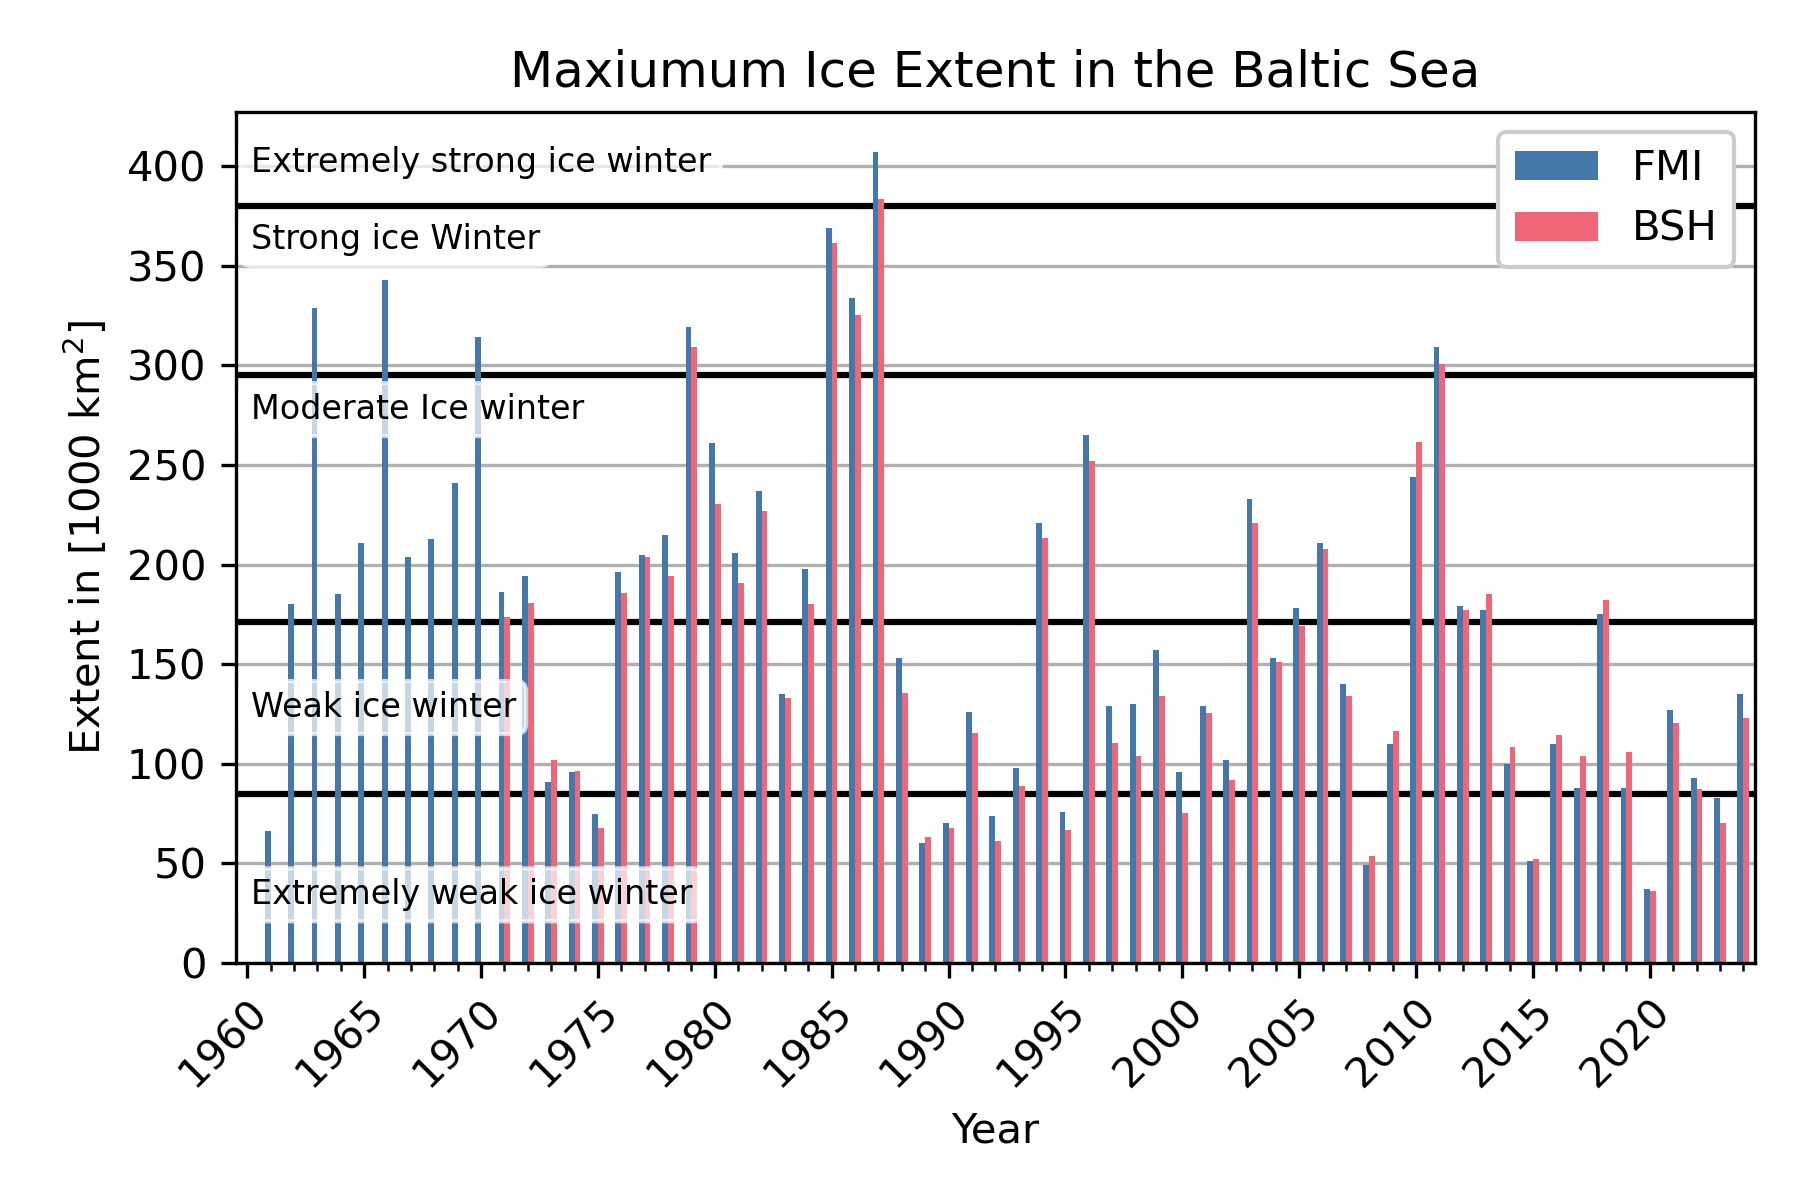
The strength of the ice winter is determined by the maximum ice extent. A maximum ice extent of 123000 km2 was measured in the ice charts of the BSH on 14 February 2024. In the Swedish/Finnish ice charts the maximum 135000 km2 were reached 12 February 2024. On the one hand the difference is caused by the time difference between the chart dates as some new ice in the Sea of Bothnia and the Gulf of Finland has vanished within the two days. On the other hand, there are systematic differences due to the subjective interpretation of satellite imagery and other ice information, differences in the calculation of the maximum ice extent and the used landmasks.The classification of the ice winter in five categories from extreme weak to extreme strong is done according to the method of Nusser [4]. The ice winter 2023/24 was a weak ice winter according to this classification. The ice winter was stronger than the last five ice winter. In a three-part classification (mild, normal, severe) from the Swedish and Finnish ice services it was a normal ice winter (>115000km2, <230000 km2). A time series of the maximum ice extent from the Finnish ice service and the BSH since 1961 is shown in Figure 14. The maximum ice extent of both services follows the same trend but there are differences in the values due to above discussed reasons.
6 Reporting of the BSH
The BSH informed about ice conditions and expected ice development in the entire Baltic Sea and German coastal waters by the following reports and ice charts:
The weekly report with a review and an outlook of the ice situation in the Baltic as well as with a glimpse of the ice situation at the poles is issued weekly throughout the year since 2022.
Bibliography
- Deutscher Wetterdienst (2024, 28. Februar), Deutschlandwetter im Winter 2023/24 [Pressemitteilung], https://www.dwd.de/DE/presse/pressemitteilungen/DE/2024/20240228_deutschlandwetter_winter2023-2024_news.html
- Deutscher Wetterdienst, Die Witterung in den deutschen Küstengebieten, https://www.dwd.de/DE/leistungen/witterungkueste/witterungkueste.html
- Koslowski, G., 1989: Die flächenbezogene Eisvolumensumme, eine neue Maßzahl für die Bewertung des Eiswinters an der Ostseeküste Schleswig-Holsteins und ihr Zusammenhang mit dem Charakter des meteorologischen Winters. Dt. hydrogr. Z. 42, 61-80
- Nusser, F., 1948: Die Eisverhältnisse des Winters 1947/48 an den deutschen Küsten. Dt. hydrogr. Z. 1, 149–156
Appendix
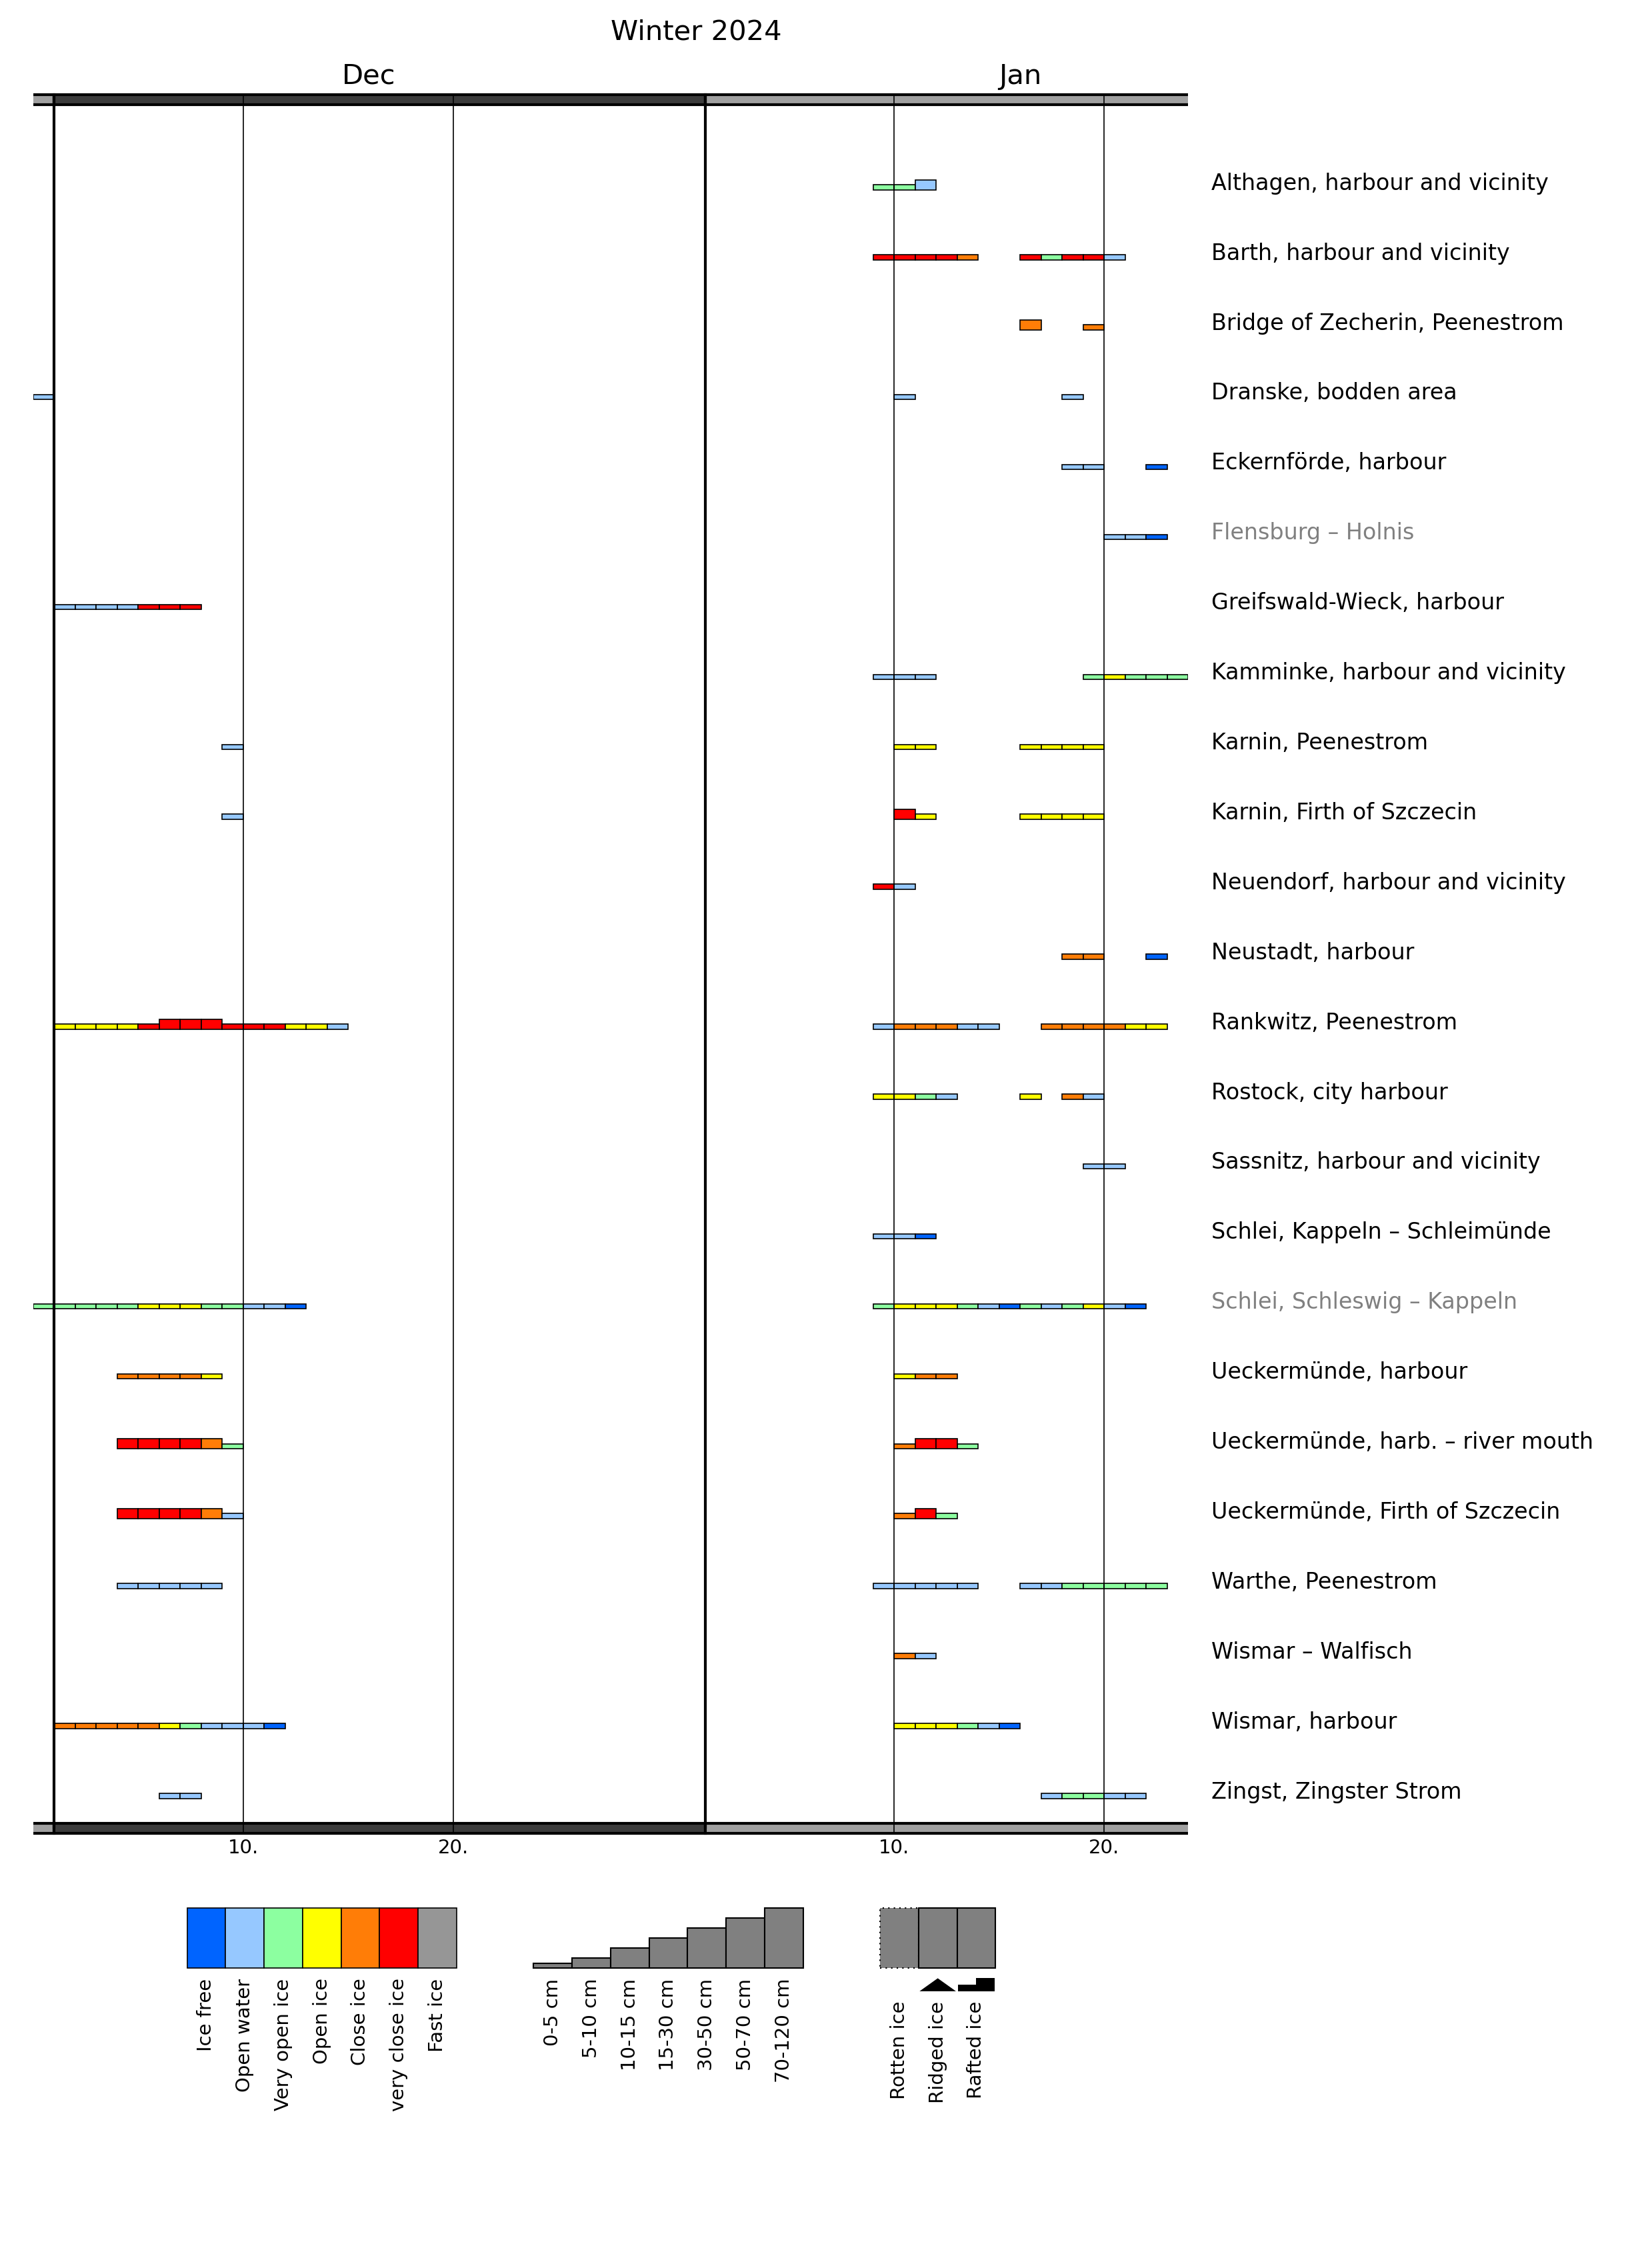
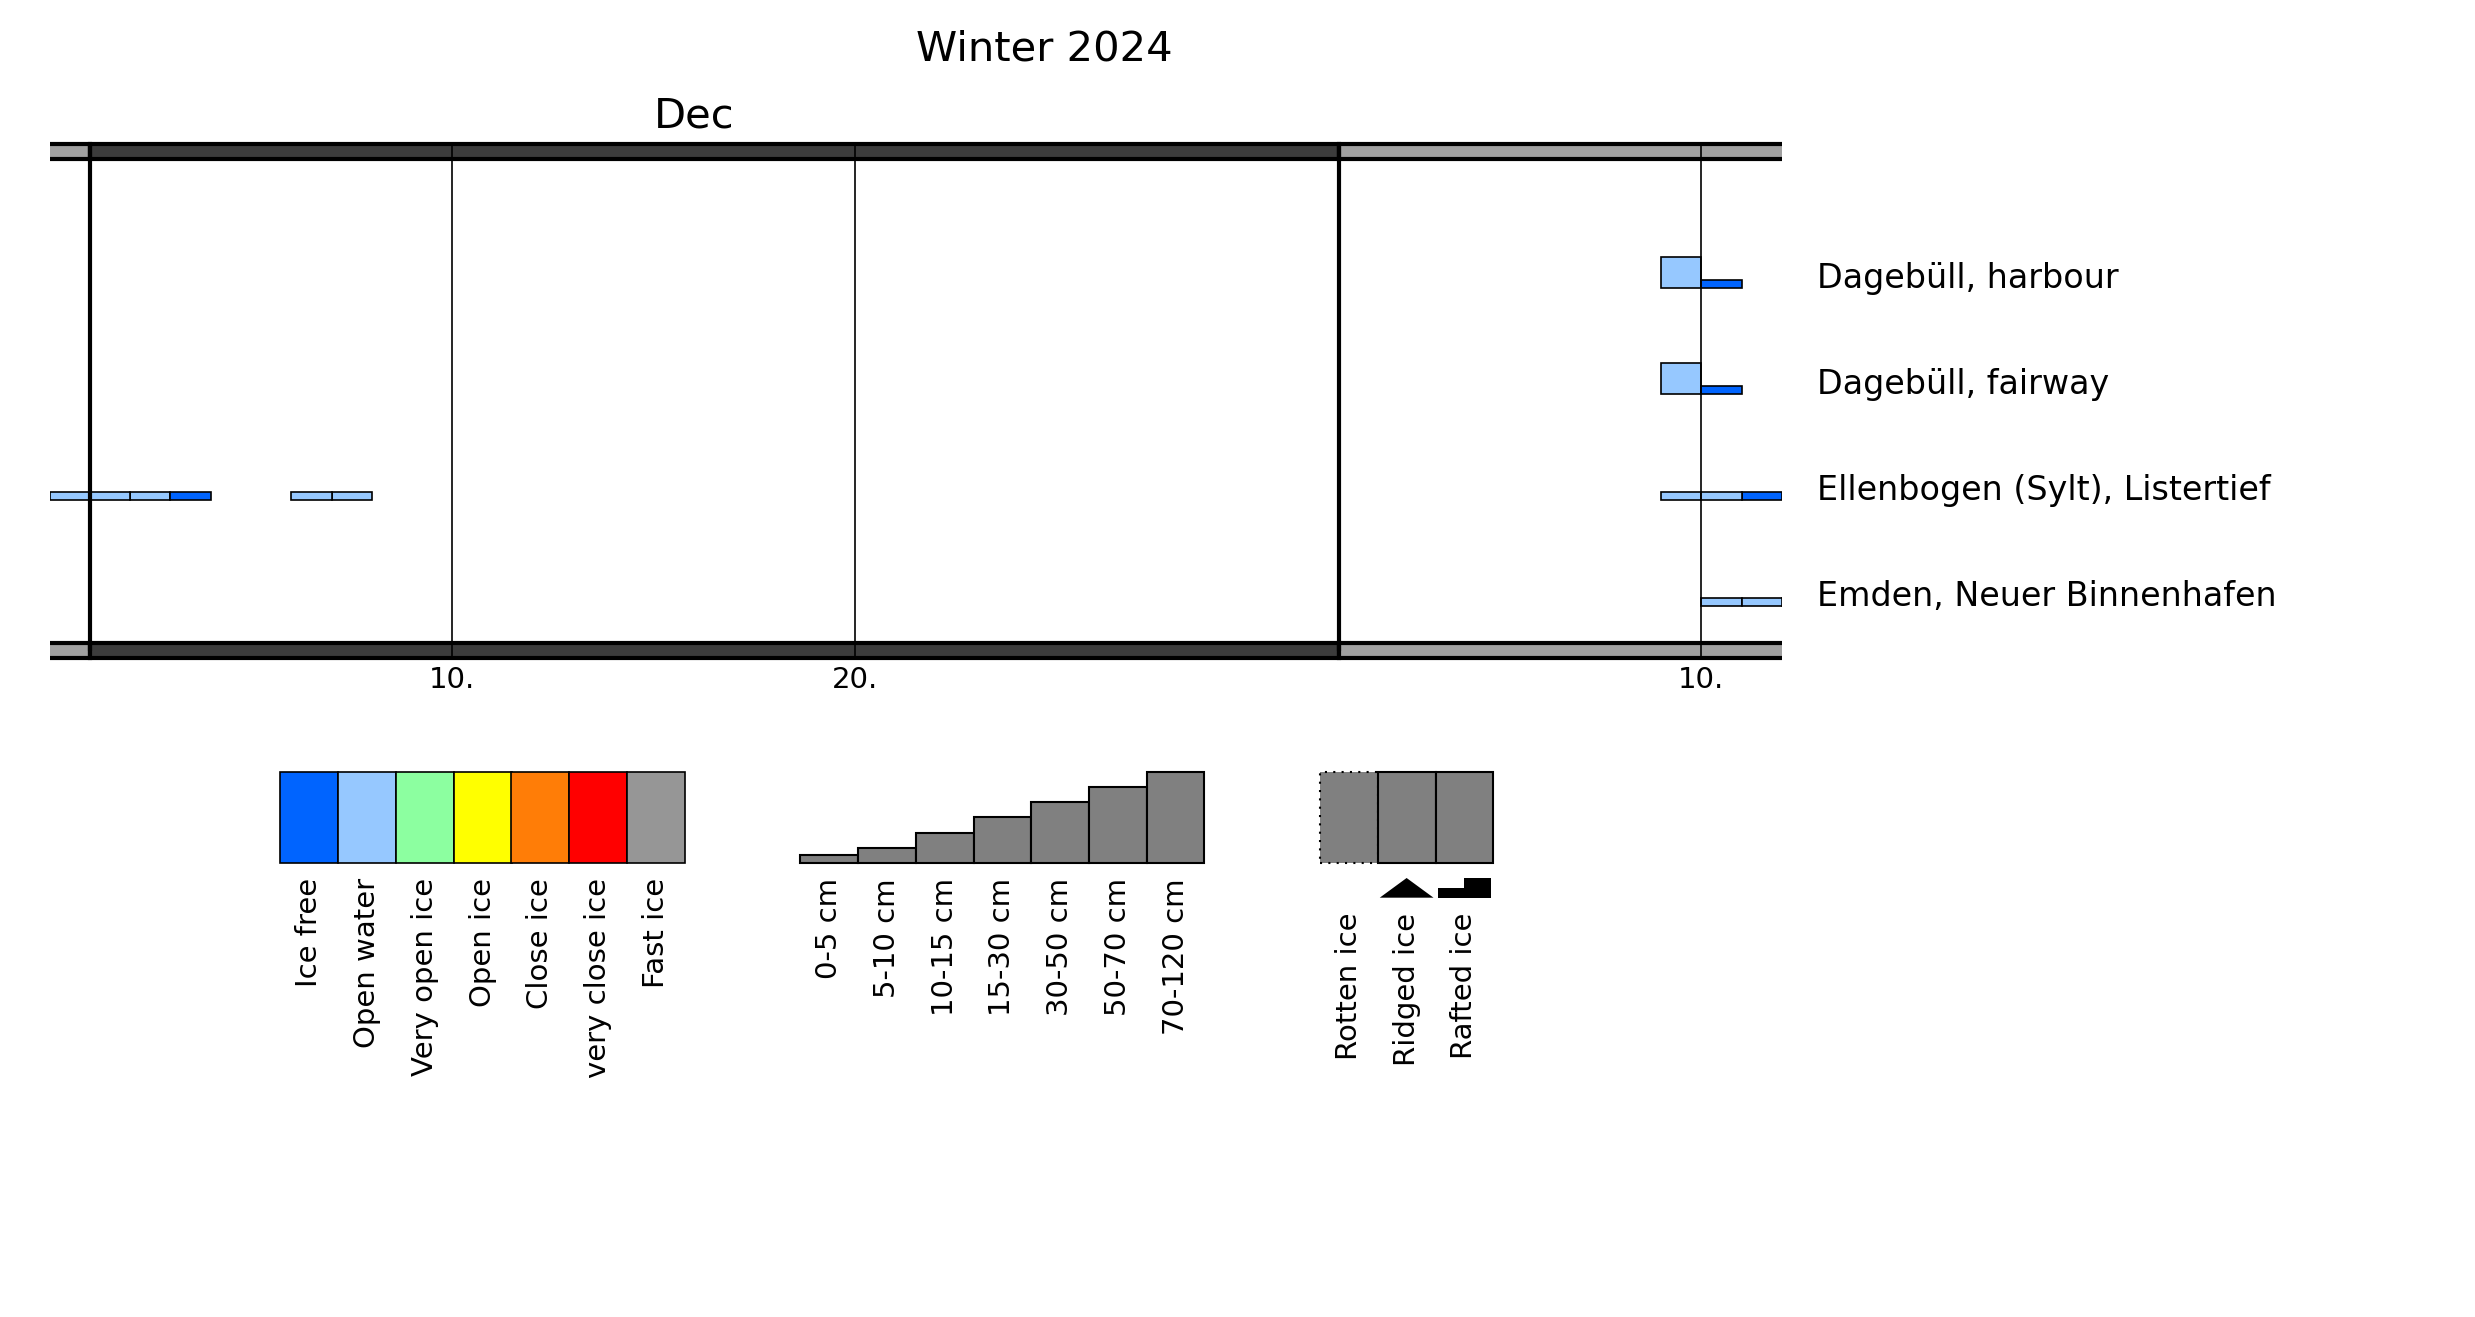
A. Ice conditions at the German coasts
| Begin | End | Days with ice | max.
ice thickness [cm] (Measurement) |
max.
ice thickness [cm]* (Baltic Sea ice code) |
|
|---|---|---|---|---|---|
| Althagen, harbour and vicinity | 09.01. | 11.01. | 3 | [—] | 10 |
| Barth, harbour and vicinity | 09.01. | 20.01. | 10 | 2.0 | 5 |
| Bridge of Zecherin, Peenestrom | 16.01. | 19.01. | 2 | [—] | 10 |
| Dranske, bodden area | 30.11. | 18.01. | 3 | [—] | 5 |
| Eckernförde, harbour | 18.01. | 19.01. | 2 | 5.0 | 5 |
| Flensburg – Holnis | 20.01. | 21.01. | 2 | [—] | 5 |
| Greifswald-Wieck, harbour | 01.12. | 07.12. | 7 | 4.0 | 5 |
| Kamminke, harbour and vicinity | 09.01. | 23.01. | 8 | 3.0 | 5 |
| Karnin, Firth of Szczecin | 09.12. | 19.01. | 7 | [—] | 10 |
| Karnin, Peenestrom | 09.12. | 19.01. | 7 | [—] | 5 |
| Neuendorf, harbour and vicinity | 09.01. | 10.01. | 2 | [—] | 5 |
| Neustadt, harbour | 18.01. | 19.01. | 2 | 1.0 | 5 |
| Rankwitz, Peenestrom | 01.12. | 22.01. | 26 | 6.0 | 10 |
| Rostock, city harbour | 09.01. | 19.01. | 7 | [—] | 5 |
| Sassnitz, harbour and vicinity | 19.01. | 20.01. | 2 | [—] | 5 |
| Schlei, Kappeln – Schleimünde | 09.01. | 10.01. | 2 | 1.0 | 5 |
| Schlei, Schleswig – Kappeln | 30.11. | 20.01. | 23 | 3.0 | 5 |
| Ueckermünde, Firth of Szczecin | 04.12. | 12.01. | 9 | [—] | 10 |
| Ueckermünde, harb. – river mouth | 04.12. | 13.01. | 10 | [—] | 10 |
| Ueckermünde, harbour | 04.12. | 12.01. | 8 | [—] | 5 |
| Warthe, Peenestrom | 04.12. | 22.01. | 17 | [—] | 5 |
| Wismar – Walfisch | 10.01. | 11.01. | 2 | [—] | 5 |
| Wismar, harbour | 01.12. | 14.01. | 15 | 2.0 | 5 |
| Zingst, Zingster Strom | 06.12. | 21.01. | 7 | 3.0 | 5 |
| Begin | End | Days with ice | max.
ice thickness [cm] (Measurement) |
max.
ice thickness [cm]* (Baltic Sea ice code) |
|
|---|---|---|---|---|---|
| Dagebüll, fairway | 09.01. | 09.01. | 1 | [—] | 15 |
| Dagebüll, harbour | 09.01. | 09.01. | 1 | [—] | 15 |
| Ellenbogen (Sylt), Listertief | 30.11. | 10.01. | 7 | 5.0 | 5 |
| Emden, Neuer Binnenhafen | 10.01. | 11.01. | 2 | 2.0 | 5 |
B. Baltic Sea ice codes of German stations.